. 2009 Oct;256(1-2):118-30.
doi: 10.1016/j.heares.2009.07.005. Epub 2009 Jul 18.

Dynamics of spectro-temporal tuning in primary auditory cortex of the awake ferret

Affiliations

Dynamics of spectro-temporal tuning in primary auditory cortex of the awake ferret

B Shechter et al. Hear Res. 2009 Oct.

Abstract

We previously characterized the steady-state spectro-temporal tuning properties of cortical cells with respect to broadband sounds by using sounds with sinusoidal spectro-temporal modulation envelope where spectral density and temporal periodicity were constant over several seconds. However, since speech and other natural sounds have spectro-temporal features that change substantially over milliseconds, we study the dynamics of tuning by using stimuli of constant overall intensity, but alternating between a flat spectro-temporal envelope and a modulated envelope with well defined spectral density and temporal periodicity. This allows us to define the tuning of cortical cells to speech-like and other rapid transitions, on the order of milliseconds, as well as the time evolution of this tuning in response to the appearance of new features in a sound. Responses of 92 cells in AI were analyzed based on the temporal evolution of the following measures of tuning after a rapid transition in the stimulus: center of mass and breadth of tuning; separability and direction selectivity; temporal and spectral asymmetry. We find that tuning center of mass increased in 70% of cells for spectral density and in 68% of cells for temporal periodicity, while roughly half of cells (47%) broadened their tuning, with the other half (53%) sharpening tuning. The majority of cells (73%) were initially not direction selective, as measured by an inseparability index, which had an initial low value that then increased to a higher steady state value. Most cells were characterized by temporal symmetry, while spectral symmetry was initially high and then progressed to low steady-state values (61%). We demonstrate that cortical neurons can be characterized by a lag-dependent modulation transfer function. This characterization, when measured through to steady-state, becomes equivalent to the classical spectro-temporal receptive field.


Figures

Fig. 1
Fig. 1
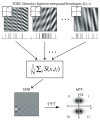
Spectro-temporal reverse correlation with TORC stimuli. (Top) Three typical TORC spectro-temporal envelopes. They are the sums of gratings with spectral densities 1 cyc/oct (left), 3/7 cyc/oct (middle), and 1/7 cyc/oct (right). Each stimulus depicted contained temporal periodicities from 4 to 32 Hz in steps of 4 Hz. Presentation of each stimulus lasted for 6 seconds (24 periods of 250 msec each). Inset are the two dimensional Fourier transforms of the stimuli. Below each stimulus is a cartoon representation of the spike trains they elicit. (Middle) Reverse correlation of the spike trains with the stimulus spectro-temporal envelopes. For each spike event, we average a full period of the stimulus envelope that preceded it to obtain the cell’s STRF (Bottom). The cell’s modulation transfer function (MTF) is the two dimensional Fourier transform of its STRF. Note that the MTF is complex-conjugate symmetric, where quadrants I and III and quadrants II and IV are equal in amplitude, but opposite in phase.
Fig. 2
Fig. 2
(Top) Spectro-temporal envelope of a transient grating stimulus. The stimulus has a flat envelope with eight 50 msec transient segments of grating modulation interspersed. Each transient has the same density (Ω) and temporal periodicity (w), but starts at a different phase (φ). The actual stimulus has random intertransient intervals. (Middle) The response of a neuron to the stimulus shown at top, aligned to the stimulus onset time. We compute transient modulation transfer functions (tMTF) for each lag, τ. For a given τ and for each starting phase, we compute the average spiking rate in a window of duration (8 · w)−1 sec. These windows for a specific choice of τ are depicted by the gray boxes overlying the response curve. (Bottom) For the same τ, the spiking rates evoked by each phase of the modulation are Fourier transformed and the amplitude and phase of the first harmonic extracted. This is a measure of phase-locking to modulations in the stimulus at τ msec after the transient onset for the (Ω, w) pair presented.
Fig. 3
Fig. 3
Equivalence for steady-state sounds of the standard method of deriving STRFs with the instantaneous method used in this paper. In the standard method (bottom right), we measure the phase and amplitude of the neural response for a full period of the stimulus (denoted by ‘A’). Alternatively, for an instantaneous measurement (bottom left), we present our continuous or long duration sound 4 times, each with a different starting phase and at a given time, measure the cell’s response over 1/4 of a cycle (denoted by ‘1’–‘4’). Concatenating these 1/4 cycle responses yields the cell’s tuning for a full cycle of the response, but at a specific moment in time. This method is used in the paper with 8 starting phases instead of 4.
Fig. 4
Fig. 4
Raster plot of responses to transient gratings. Each waveform is presented 10 times, with the grating transients presented at 8 starting phases (phase values shown above the rasters). Each transient is 50 msec in duration. Each dot represents an action potential. The gray line is a PSTH, measured with 25 msec bins. The vertical dotted lines indicate the times at which each feature transient began. The solid vertical lines at 0 msec and 1250 msec indicate the times at which the sound was turned on and off, respectively. The 2 cells shown here and used in the following figures are examples of the 2 broad categories of cells we have found—those with dynamics in their tuning (cell 35) and those without dynamics (cell 47).
Fig. 4
Fig. 4
Raster plot of responses to transient gratings. Each waveform is presented 10 times, with the grating transients presented at 8 starting phases (phase values shown above the rasters). Each transient is 50 msec in duration. Each dot represents an action potential. The gray line is a PSTH, measured with 25 msec bins. The vertical dotted lines indicate the times at which each feature transient began. The solid vertical lines at 0 msec and 1250 msec indicate the times at which the sound was turned on and off, respectively. The 2 cells shown here and used in the following figures are examples of the 2 broad categories of cells we have found—those with dynamics in their tuning (cell 35) and those without dynamics (cell 47).
Fig. 5
Fig. 5
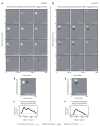
(A,D) Lag Dependent Transient Receptive Fields are shown for two representative cells in auditory cortex. Each frame shown is the inverse Fourier transform of the tMTF at 5 msec interval lags, which was computed using the method depicted in Fig. 2. Cell 35 (A) shows tuning with sideband inhibitory regions at intermediate lags (from τ = 20 msec to τ = 40 msec), but these regions are not seen in the steady-state. Cell 47 (D) has tuning which exhibits an accumulation of direction selectivity with increasing lag. (B,E) The steady-state STRFs obtained through reverse correlation with TORC stimuli for the same cells in A and D, respectively. (C,F) The total power in the transient modulation transfer functions is plotted as a function of lag for the two cells. This value is used to determine whether there is a significant response to the transient gratings. The thresholds are plotted by the dashed lines at 10% of the maximum response from baseline and points above threshold are stressed in bold. Horizontal gray bars indicate the 16-msec analysis windows used to compute the trends for the α parameters. Data for an additional 4 cells are shown in supplemental figures.
Fig. 6
Fig. 6
The center of mass was computed for the tMTF at each lag in the quadrant which had the greater power throughout the response. We fit the temporal progression linearly (both in spectral density Ω and in temporal periodicity w) at the lag corresponding to the first significant peak in the modulation power (gray bars in B and C). A) The distributions of fit slopes describing the change in center of mass with increasing lag are shown in the histograms (left: Ω, right: w). Both quantities increased for most cells (70% for Ω and 68% for w). B,C) Center of mass (left: Ω, right: w) as a function of lag for Cells 35 and 47 (Fig. 5). Lags at which the response was significant (determined from the total modulation power) are indicated in bold.
Fig. 7
Fig. 7
αb was computed for the tMTF at each lag. The best linear fit to αb (τ) was found at the first significant peak in the modulation power (indicated by the gray bars in B and C). A) The distribution of fit slopes for all cells analyzed in this study are depicted. 47% broadened their tuning and 53% sharpened tuning as a function of lag. B,C) Example traces of αb (τ) for Cells 35 and 47 (see Fig. 5). Lags for which the response was significant are indicated in bold.
Fig. 8
Fig. 8
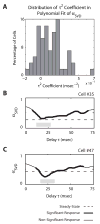
αSVD was computed for the tMTF at each lag, and its temporal progression, αSVD (τ) was fit with a second-order polynomial. A) The distribution of the second order coefficients τ2 for all cells analyzed in this study are shown in the histogram. The majority of cells (73%) had a positive second order coefficient, corresponding to a concave behavior, in which αSVD first decreases and then rises back to either a steady-state or continues to increase. B,C) Example traces of αSVD for Cells 35 and 47 (Fig. 5). Both cells exhibit the behavior described above. The significant part of the response is indicated in bold. The dashed line indicates the value of αSVD obtained from the steady-state STRF. The first significant peaks of the modulation powers for the two cells are indicated by the horizontal gray bars.
Fig. 9
Fig. 9
A) αt (left) and αs (right) for the tMTF at each lag for Cell 35. Both αt and αs quickly decay to a near-zero value, and αs gradually increases to the steady-state value. B) Same as in A for Cell 47. Both αt and αs decay to a near-zero value again, but with a longer latency. In contrast to Cell 35, αs reaches a higher steady-state value at a shorter latency. Significant responses are indicated in bold, and the dashed line indicates the steady-state value.

Similar articles

Cited by

References

    1. Abdi H. Singular Value Decomposition (SVD) and Generalized Singular Value Decomposition (GSVD) In: Salkind NJ, editor. Encyclopedia of Measurement and Statistics. Thousand Oaks, CA: Sage; 2007.
    1. Aertsen AM, Johannesma PI. A comparison of the spectro-temporal sensitivity of auditory neurons to tonal and natural stimuli. Biological Cybernetics. 1981;42:145–156. - PubMed
    1. Bajo VM, Nodal FR, Bizley JK, Moore DR, King AJ. The Ferret Auditory Cortex: Descending Projections to the Inferior Colliculus. Cereb Cortex. 2006 - PMC - PubMed
    1. Bredfeldt CE, Ringach DL. Dynamics of spatial frequency tuning in macaque V1. J Neurosci. 2002;22:1976–1984. - PMC - PubMed
    1. deCharms RC, Blake DT, Merzenich MM. Optimizing sound features for cortical neurons.[see comment] Science. 1998;280:1439–1443. - PubMed

Publication types