. 2009 Sep;29(18):4949-58.
doi: 10.1128/MCB.00383-09. Epub 2009 Jul 20.

Repression of ESR1 through actions of estrogen receptor alpha and Sin3A at the proximal promoter

Affiliations

Repression of ESR1 through actions of estrogen receptor alpha and Sin3A at the proximal promoter

Stephanie J Ellison-Zelski et al. Mol Cell Biol. 2009 Sep.

Abstract

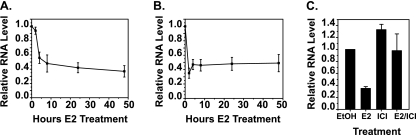
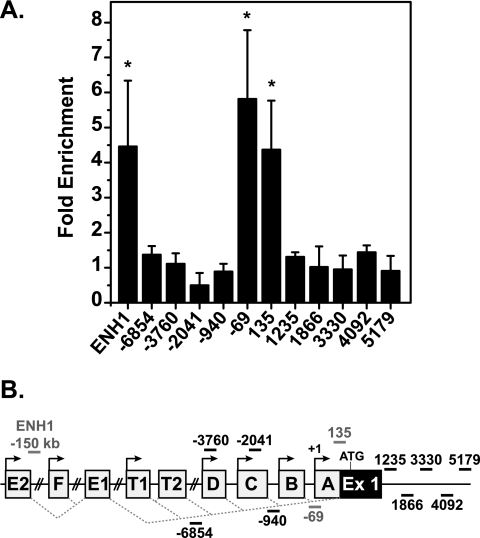
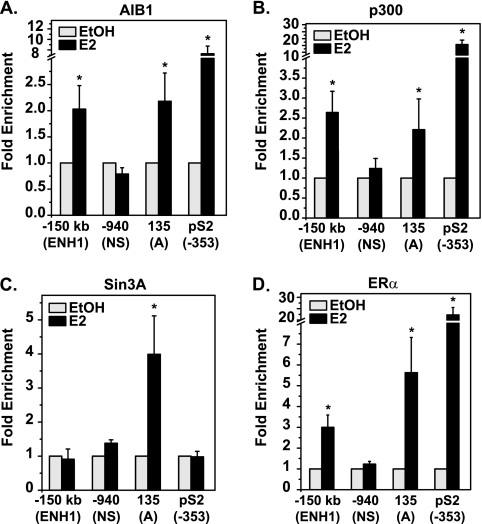
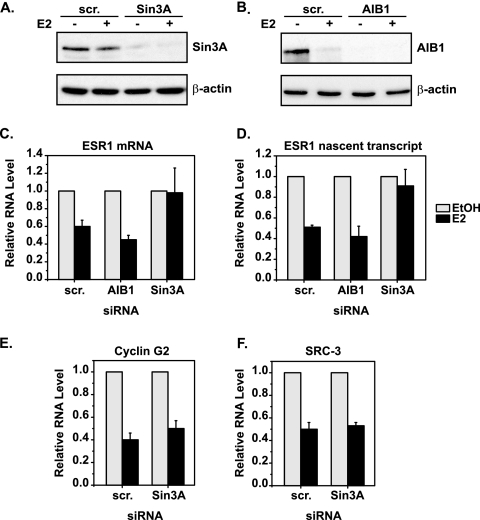
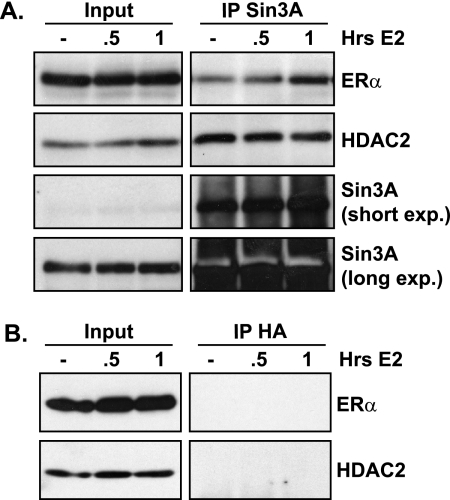
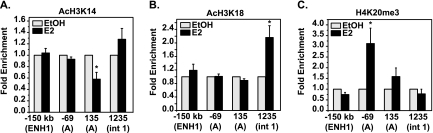
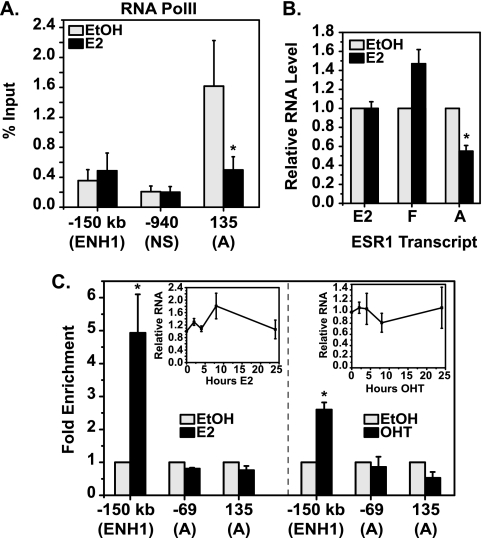
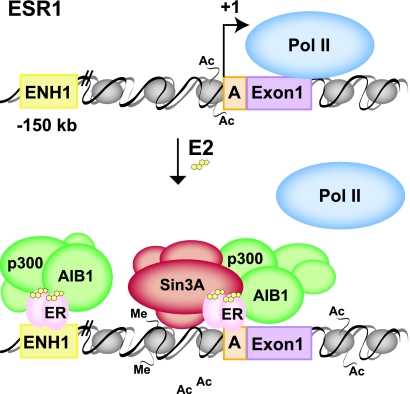
Gene expression results from the coordinated actions of transcription factor proteins and coregulators. Estrogen receptor alpha (ERalpha) is a ligand-activated transcription factor that can both activate and repress the expression of genes. Activation of transcription by estrogen-bound ERalpha has been studied in detail, as has antagonist-induced repression, such as that which occurs by tamoxifen. How estrogen-bound ERalpha represses gene transcription remains unclear. In this report, we identify a new mechanism of estrogen-induced transcriptional repression by using the ERalpha gene, ESR1. Upon estrogen treatment, ERalpha is recruited to two sites on ESR1, one distal (ENH1) and the other at the proximal (A) promoter. Coactivator proteins, namely, p300 and AIB1, are found at both ERalpha-binding sites. However, recruitment of the Sin3A repressor, loss of RNA polymerase II, and changes in histone modifications occur only at the A promoter. Reduction of Sin3A expression by RNA interference specifically inhibits estrogen-induced repression of ESR1. Furthermore, an estrogen-responsive interaction between Sin3A and ERalpha is identified. These data support a model of repression wherein actions of ERalpha and Sin3A at the proximal promoter can overcome activating signals at distal or proximal sites and ultimately decrease gene expression.


Figures

FIG. 1.
FIG. 1.
ERα mediates E2-induced transcriptional repression of ESR1. qRT-PCR was used to analyze the expression of (A) total ESR1 or (B) nascent ESR1 (intron 1 primers) in MCF7 cells following treatment with 10 nM E2. Data shown are relative to those of a vehicle (EtOH)-treated control. (C) MCF7 cells were treated for 24 h with EtOH, 10 nM ICI, 10 nM E2, or 10 nM E2 in combination with 100 nM ICI. Levels of total ESR1 were detected by qRT-PCR and are represented relative to those of vehicle-treated cells. Error bars show the standard error of the mean of at least three independent experiments.
FIG. 2.
FIG. 2.
ERα binds proximal and distal sites on ESR1 in response to E2. (A) MCF7 cells were treated for 24 h with EtOH or 10 nM E2 and harvested for ChIP with ERα antibody. qRT-PCR was performed with the ESR1 primer set indicated. Data are normalized to input values and calculated as enrichment versus an EtOH-treated control for each amplicon. Error bars are the standard error of the mean of at least three independent experiments. Statistical significance of increased ERα binding in the presence of E2 was determined with the Student t test for paired data (*, P < 0.05) on raw percent input values. (B) Diagram of ESR1 promoter regions with primer locations indicated and ERα-binding sites in red. Ex, exon.
FIG. 3.
FIG. 3.
Sin3A is exclusively found at the proximal promoter of ESR1, while activators are recruited to both ERα-binding sites. MCF7 cells were treated with EtOH or 10 nM E2 for 30 min and processed for ChIP analysis of (A) AIB1, (B) p300, (C) Sin3A, or (D) ERα occupancy. qRT-PCR was performed with primers for three sites of ESR1: ENH1, the nonspecific region (NS), and the A promoter. The pS2 promoter is included as a control E2-activated gene. Data are normalized to the input and calculated as enrichment versus the EtOH-treated control for each amplicon, with error bars representing the standard error of the mean of at least three independent experiments. Statistical significance of increased binding in the presence of E2 was determined with the Student t test for paired data (*, P < 0.05) on raw percent input values.
FIG. 4.
FIG. 4.
Sin3A is specifically required for repression of ESR1. MCF7 cells were transfected with scrambled (scr.), Sin3A, or AIB1 siRNA and then treated with EtOH or 10 nM E2 for 4 h. Levels of the (A) Sin3A and (B) AIB1 proteins were verified by Western blot analysis, with β-actin serving as a loading control. qRT-PCR was used to determine the levels of (C) total ESR1 mRNA, (D) ESR1 nascent transcript (intron 1 primers), (E) cyclin G2 mRNA, and (F) SRC-3 mRNA under the experimental conditions described above. Data shown are relative to those of the EtOH-treated control for each siRNA condition, with error bars representing the standard error of the mean of at least three independent experiments.
FIG. 5.
FIG. 5.
Sin3A and ERα interact in an E2-responsive manner. MCF7 cells were treated with EtOH or 10 nM E2 and harvested for coimmunoprecipitation at the indicated times. Four percent of the total sample was removed for inputs before IP. The remaining lysate was immunoprecipitated with (A) Sin3A or (B) control HA antibody and analyzed by Western blot analysis for ERα, HDAC2, or Sin3A where indicated. exp., exposure.
FIG. 6.
FIG. 6.
Changes in histone modifications occur near the proximal ERα-binding site on ESR1 where Sin3A binds. MCF7 cells were treated with EtOH or 10 nM E2 for 2 h and processed for ChIP analysis of the histone modifications (A) AcH3 lysine 14 (AcH3K14), (B) AcH3 lysine 18 (AcH3K18), and (C) trimethylated histone H4 lysine 20 (H4K20me3). ENH1, two regions near the A promoter, and intron 1 (int 1) of ESR1 were amplified by qRT-PCR. Data are normalized to the input and calculated as enrichment versus the EtOH control, with error bars representing the standard error of the mean of at least three independent experiments. Statistical significance of histone modification changes in the presence of E2 was determined with the Student t test for paired data (*, P < 0.05) on raw percent input values.
FIG. 7.
FIG. 7.
The proximal ERα-binding site is associated with transcriptional repression of ESR1. (A) ChIP analysis for RNA PolII was carried out with MCF7 cells treated with EtOH or 10 nM E2 for 1 h. Data are shown as a percentage of the input for the indicated ESR1 amplicon. Statistical significance of changes in PolII occupancy in the presence of E2 was determined with the Student t test for paired data (*, P < 0.05). (B) MCF7 cells were treated with EtOH or 10 nM E2 for 2 h. Levels of A, E2-E1, and F-E1 transcripts were detected by qRT-PCR and are shown relative to those of vehicle-treated cells. Statistical significance of transcript expression changes in the presence of E2 was determined with the Student t test for paired data (*, P < 0.05). (C) T47D cells were treated with 10 nM E2 (left panel), and MCF7 cells were treated with 100 nM OHT (right panel) for 24 h and processed for ChIP analyses with an ERα antibody. qRT-PCR was performed for the two ERα-binding sites identified: ENH1 or the A promoter of ESR1. Data are normalized to the input and calculated as enrichment versus an EtOH-treated sample for each amplicon. Insets show qRT-PCR data for total ESR1 RNA from the corresponding treatment groups, relative to those for an EtOH-treated sample. Statistical significance of increased ERα binding in the presence of E2 was determined with the Student t test for paired data (*, P < 0.05) on raw percent input values. Error bars show the standard error of the mean of at least three independent experiments.
FIG. 8.
FIG. 8.
Model of E2-induced repression of ESR1. For details, see the text. Me, methylation; Ac, acetylation.

Similar articles

Cited by

References

    1. Alarid, E. T., N. Bakopoulos, and N. Solodin. 1999. Proteasome-mediated proteolysis of estrogen receptor: a novel component in autologous down-regulation. Mol. Endocrinol. 131522-1534. - PubMed
    1. An, J., R. C. Ribeiro, P. Webb, J. A. Gustafsson, P. J. Kushner, J. D. Baxter, and D. C. Leitman. 1999. Estradiol repression of tumor necrosis factor-alpha transcription requires estrogen receptor activation function-2 and is enhanced by coactivators. Proc. Natl. Acad. Sci. USA 9615161-15166. - PMC - PubMed
    1. Ayer, D. E., Q. A. Lawrence, and R. N. Eisenman. 1995. Mad-Max transcriptional repression is mediated by ternary complex formation with mammalian homologs of yeast repressor Sin3. Cell 80767-776. - PubMed
    1. Berger, S. L. 2007. The complex language of chromatin regulation during transcription. Nature 447407-412. - PubMed
    1. Berkenstam, A., H. Glaumann, M. Martin, J. A. Gustafsson, and G. Norstedt. 1989. Hormonal regulation of estrogen receptor messenger ribonucleic acid in T47D and MCF-7 breast cancer cells. Mol. Endocrinol. 322-28. - PubMed

Publication types

MeSH terms

LinkOut - more resources