. 2009 Aug 15;183(4):2415-24.
doi: 10.4049/jimmunol.0804014. Epub 2009 Jul 20.

HIV-1 Nef promotes endocytosis of cell surface MHC class II molecules via a constitutive pathway

Affiliations

HIV-1 Nef promotes endocytosis of cell surface MHC class II molecules via a constitutive pathway

Ashutosh Chaudhry et al. J Immunol. .

Erratum in

  • J Immunol. 2009 Dec 1;183(11):7611

Abstract

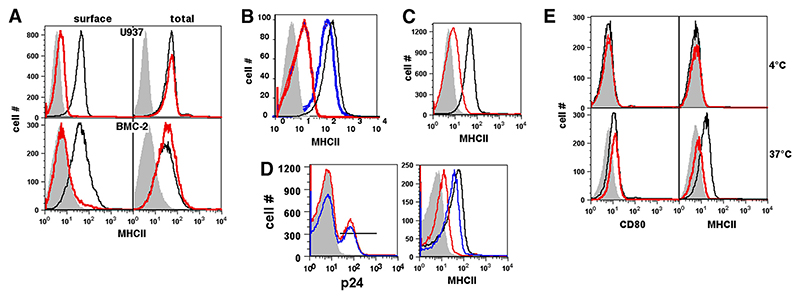
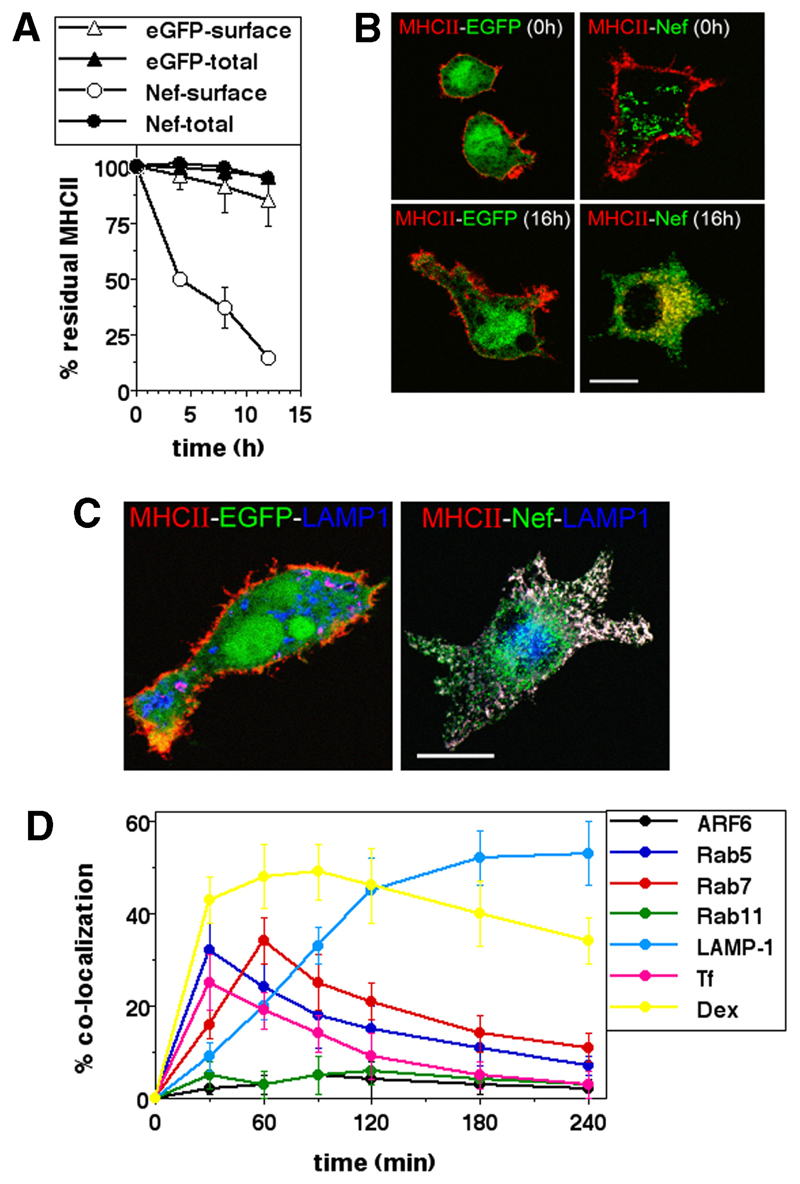
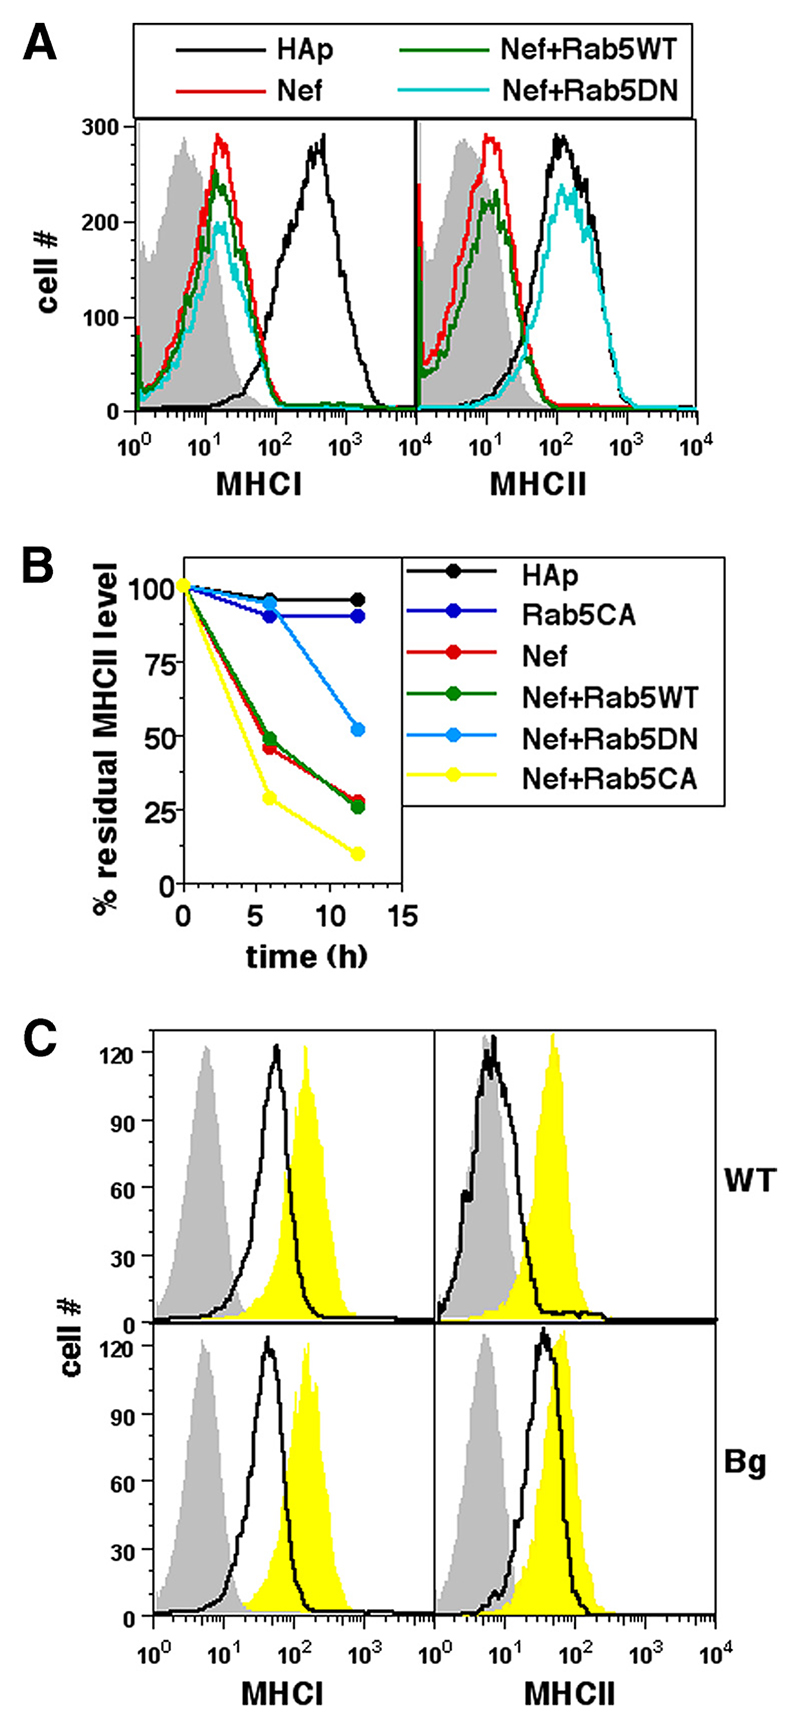
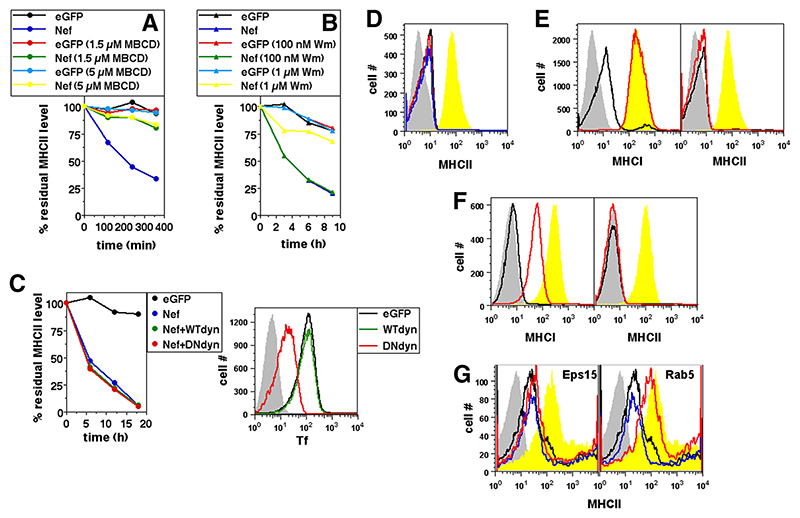
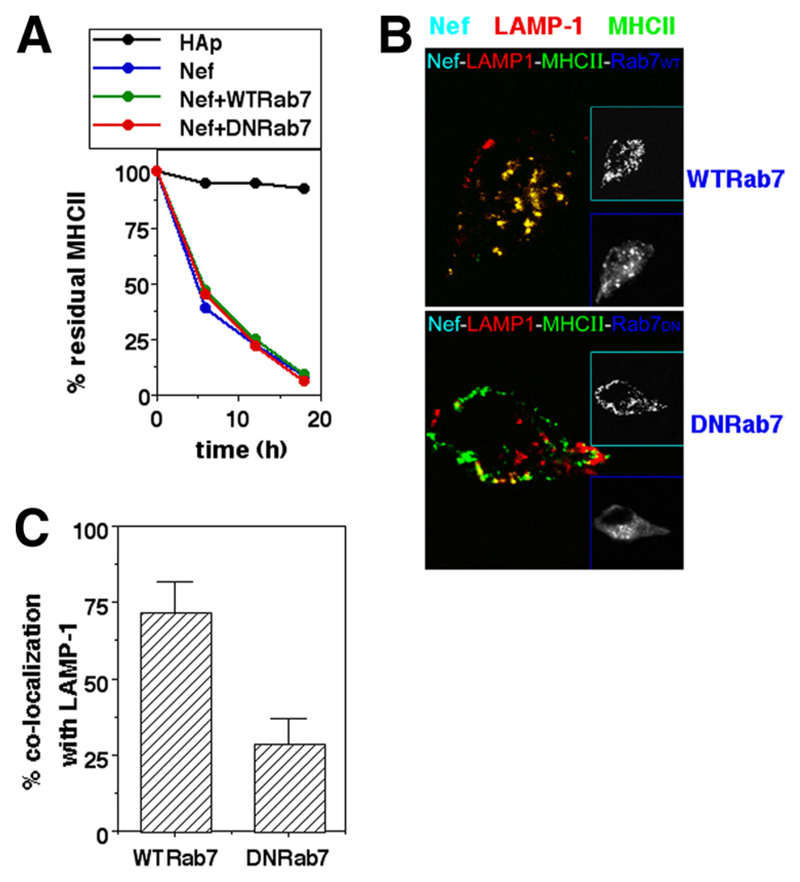
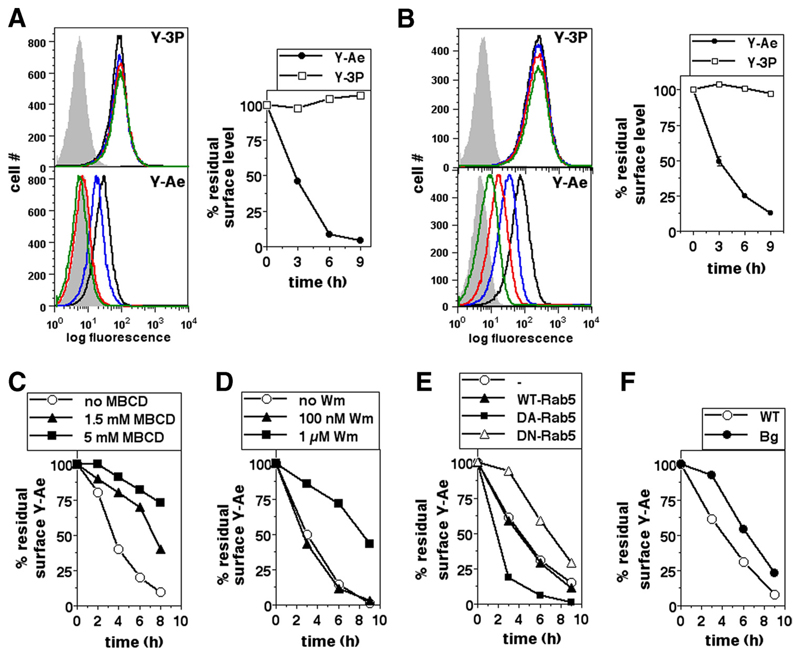
HIV-1 Nef has been reported to disrupt MHC class II (MHCII)-mediated Ag presentation by a dual strategy that comprises a reduction in cell surface levels of peptide-loaded mature MHCII molecules and a up-regulation of immature MHCII molecules. We show that Nef achieves relocation of MHCII away from the cell surface in monocytic cells by both delaying its transport to the cell surface and by accelerating endocytic removal of cell surface MHCII to a lysosomal compartment. Nef-induced MHCII endocytosis is cholesterol-sensitive but clathrin- and dynamin-independent. Internalized MHCII molecules traverse the early endosomal system and colocalize with pinocytic cargo before reaching lysosomes. Nef-triggered MHCII endocytosis requires Rab5 activity and lyst function, whereas lysosomal trafficking of internalized MHCII molecules requires Rab7 activity. We further show that a similar pathway can remove peptide-MHCII complexes from the surface of monocytic cells not expressing Nef. Our data suggest that Nef uses mechanisms involved in normal MHCII recycling and turnover to mediate the delivery of cell surface MHCII to a lysosomal destination. Thus, Nef-mediated endocytosis of MHCII provides a novel perspective on the regulation of normal MHCII trafficking.


Conflict of interest statement

Disclosures

The authors declare that they have no competing financial interests.

Figures

Figure 1
Figure 1. HIV-1 Nef reduces cell surface but not total MHCII levels on human and mouse myeloid cells.
A, U937 or BMC-2 cells were transfected to express either eGFP alone (black lines) or Nef and eGFP (red lines) and stained 24 h later for MHCII either before (surface) or after (total) permeabilization. Histograms show MHCII levels on eGFP-gated cells. B, U937 cells were either mock infected (black line) or infected with WT HIV-1 (NL4-3; blue line) or with nef-deleted NL4-3 virus (red line) and stained for cell surface MHCII and intracellular HIV-1 p24 protein 2 days later. Histograms show surface MHCII levels on p24-gated cells. C, Primary human monocytes were transfected to express either eGFP alone (black lines) or Nef and eGFP (blue lines) and stained 24 h later for cell surface MHCII. Histograms show MHCII levels on eGFP-gated cells. D, Primary human monocytes were either mock infected (black line) or infected with WT HIV-1 (NL4-3 Ada; red line) or nef-deleted NL4-3 Ada virus (blue line) and stained for cell surface MHCII and intracellular HIV-1 p24 protein 2 days later. Histograms in the left panel show p24 levels in infected cells and the p24 gate used. Histograms in the right panel show surface MHCII levels on p24-gated cells. E, U937 cells transfected to express either eGFP alone (black lines) or Nef and eGFP (red lines) were stained 12 h after transfection with anti-MHCII-biotin or anti-CD80-biotin, and held at either 4°C or 37°C as indicated. Cells were then stained with the same anti-MHCII or anti-CD80 mAbs conjugated to PE to detect newly expressed molecules. Histograms show levels of new MHCII or CD80 molecules delivered to the cell surface as detected by PE-labeled mAbs in eGFP-gated cells. Gray curves in all panels represent isotype controls. Data are representative of 3–5 independent experiments.
Figure 2
Figure 2. Nef traffics cell surface MHCII to lysosomal compartments.
A, U937 cells transfected to express either GFP alone or Nef and eGFP as indicated were surface labeled with anti-MHCII-biotin 12 h after transfection and then cultured for various times as indicated and subjected to the detection of either surface (open symbols) or total (closed symbols) label postpermeabilization. Mean fluorescence intensities were calculated for eGFP-gated cells and the data normalized to the starting intensities as a percentage of the residue of surface-labeled MHCII. The graphs show mean ± SD values of detected fluorescence label calculated from three independent experiments. B, U937 cells transfected to express eGFP (left column) or Nef-eGFP (right column) were surface-labeled 12 h later with anti-MHCII-biotin, and were either stained with labeled streptavidin-Alexa Fluor 568 immediately (0 h; top row) or cultured for 16 h before staining (16 h; bottom row), followed by confocal microscopic imaging. Scale bar, 10 μm. C, U937 cells transfected to express eGFP (left) or Nef-eGFP (right) were fixed 24 h after transfection and stained for MHCII (red; Alexa Fluor 568) and LAMP-1 (blue; Alexa Fluor 647), followed by confocal microscopy. Scale bar, 10 μm. D, U937 cells expressing Nef-eGFP were labeled for MHCII at the cell surface and cultured for various times as indicated. At each time point shown the surface label was stripped and cells were permeabilized and stained for the vesicular marker indicated. For detection of Arf6, U937 cells were cotransfected with plasmids expressing Nef-HA and Arf6-eGFP, and staining include hemagglutinin epitope detection. For tracking colocalization with dextran (Dex) or Tf, cells were given a 10-min pulse with fluorophores, Alexa Fluor 568-Tf or tetramethylrhodamine-Dex 3 h after surface labeling for MHCII. Cells were imaged by either high-resolution, wide-field fluorescence microscopy or confocal microscopy. Images of Nef-expressing cells were quantified for the fraction of internalized MHCII colocalizing with the various markers shown. Data are plotted as the extent of colocalization over time (mean ± SE; n = 100 cells).
Figure 3
Figure 3. Nef-mediated removal of cell surface MHCII requires Rab5 and Lyst.
A, U937 cells were either singly transfected or cotransfected for expression of hemagglutinin epitope (HAp) alone or F2-Nef-HAp and WT Rab5 or DN Rab5 in combinations as indicated. Cells were stained for cell surface MHCI or MHCII 24 h later and analyzed by flow cytometry. Single-color histograms show surface MHCI or MHCII levels on HAp-gated cells. Isotype controls are shown as gray-shaded curves. B, U937 cells were either singly transfected or cotransfected for expression of HAp alone or F2-Nef-HAp and WT Rab5, CA Rab5, or DN Rab5 in combinations as indicated. Cells were stained with anti-MHCII-biotin 12 h later and cultured for various times as shown before detection of the residual cell surface label. Mean fluorescence intensities were calculated for HAp-gated cells and the data were normalized to the starting intensities as a percentage of the residue of surface-labeled MHCII as shown. C, BMDMs derived from WT C57BL/6 or bg/bg (Bg) mice were transfected to express either eGFP alone (yellow curves) or Nef and GFP (black lines) and stained for cell surface MHCI or MHCII 24 h later for analysis by flow cytometry. Single-color histograms show surface MHCI or MHCII levels on eGFP-gated cells. Isotype controls are shown as gray-shaded curves.
Figure 4
Figure 4. Nef-mediated removal of cell surface MHCII is dependent on cholesterol and PIK but is independent of Dyn, Eps15, or intersectin.
A and B, U937 cells transfected to express either eGFP alone or Nef and GFP were cultured in the presence or absence of various concentrations of MBCD (A) or Wm (B) as indicated. Cells were stained with anti-MHCII 12 h later and cultured for various times as shown before detection of the residual cell surface label. Mean fluorescence intensities were calculated for eGFP-gated cells and the data normalized to the starting intensities as a percentage of the residue of surface-labeled MHCII as shown. C, U937 cells were transfected to express either eGFP or Nef and GFP and WT Dyn or DN Dyn as shown. Cells were stained with anti-MHCII 12 h after transfection and cultured for various times as shown before detection of the residual cell surface label. Mean fluorescence intensities were calculated for eGFP-gated cells and the data normalized to the starting intensities as a percentage of the residue of surface-labeled MHCII as shown (left panel). Right panel shows U937 cells transfected to express eGFP alone or with either WT Dyn or DN Dyn as indicated and given a 10-min pulse with fluorophore-labeled Tf 3 h before staining. Histograms show Tf uptake levels in eGFP-gated cells. Gray curves indicate isotype controls. D, U937 cells were transfected to express either eGFP alone (yellow curves) or Nef-positive GFP alone (black line) or with either control plasmid (blue line) or sh-Dyn (red line). Cells were stained 24 h later for MHCII. Histograms show surface MHCII levels on eGFP-gated cells. Gray curves indicate isotype controls. E and F, U937 cells were transfected to express either eGFP alone (yellow curves) or Nef and GFP alone (black line) or with DN eps15 (red line; E) or intersectin-A (red line; F). Cells were stained 24 h later for cell surface MHCI or MHCII. Histograms show surface MHCI and MHCII levels on eGFP-gated cells. Gray curves indicate isotype controls. G, Human primary monocytes were either untransfected (yellow curves) or transfected to express Nef by itself (black line) or along with either WT Eps15 (left panel; blue line) or DN Eps-15 (left panel; red line) or WT Rab5 (right panel; blue line) or DN Rab5 (right panel, red line). Cells were stained 24 h later for MHCII. Histograms show surface MHCII levels on cells gated for expression of transfected gene/s. Gray curves indicate isotype controls.
Figure 5
Figure 5. Rab7 is required for lysosomal delivery of MHCII removed from the surface in Nef-expressing cells.
A, U937 cells were either singly transfected or cotransfected for expression of hemagglutinin epitope (HAp) alone or F2-Nef-HAp or WT Rab7 or DN Rab7 in combinations as indicated. Cells were stained with anti-MHCII-biotin 12 h later and cultured for various times as shown before the detection of residual cell surface label. Mean fluorescence intensities were calculated for HAp-gated cells and the data normalized to the starting intensities as a percentage of the residue of surface-labeled MHCII. B, U937 cells transfected to express Nef-GFP with either WT Rab7 or DN Rab7-eGFP (blue) were fixed 24 h after transfection and stained for MHCII (green; Alexa Fluor 647) and LAMP-1 (red; Alexa Fluor 568) followed by confocal microscopy. Insets show gray-scale images of the same cells for cyan and blue colors as identified by the inset frames. C, Nef-HAp-expressing cells from the experiment shown in B above were quantified for the fraction of internalized MHCII colocalizing with LAMP-1 in the presence of WT Rab7 or DN Rab7 (mean + SE; n = 50 cells).
Figure 6
Figure 6. Peptide-MHCII complexes are removed from the cell surface by a mechanism at least partially dependent on cholesterol, PIK, Rab5, and Lyst.
A, BMC-2 cells were pulsed with Eap for 60 min and cultured for 0 h (black line), 3 h (blue line), 6 h (red line), or 9 h (green line) before staining with either the pMHCII-specific mAb Y-Ae or the H-2Ab -specific mAb Y-3P for flow cytometry. Gray curves indicate isotype controls. Mean fluorescence intensities were calculated for HAp-gated cells and the data normalized to the starting intensities as a percentage of the residue of surface label. B, BMC-2 cells were pulsed with Eap for 60 min and stained with either Y-Ae or Y-3P and cultured for 0 h (black line), 3 h (blue line), 6 h (red line), or 9 h (green line) before flow cytometric detection of residual cell surface label. Gray curves indicate isotype controls. Mean fluorescence intensities were calculated and the data normalized to the starting intensities as a percentage of the residue of surface label. C and D, BMC-2 cells were pulsed with Eap for 60 min and stained with either Y-Ae or Y-3P and cultured for various times in the presence or absence of various concentrations of MBCD (C) or Wm (D) as indicated before detection of the residual cell surface label. Mean fluorescence intensities were calculated and the data normalized to the starting intensities as a percentage of the residue of surface label. E, BMC-2 cells transfected to express either eGFP alone or with WT Rab5, CA Rab5, or DN Rab5 as indicated were pulsed with Eap for 60 min and stained with either Y-Ae or Y-3P and cultured for various times as shown before detection of the residual cell surface label. Mean fluorescence intensities were calculated and the data normalized to the starting intensities as a percentage of the residue of the surface label. F, BMDMs derived from WT C57BL/6 or bg/bg (Bg) mice were pulsed with Eap for 60 min and stained with either Y-Ae or Y-3P and cultured for various times as indicated before detection of residual cell surface label. Mean fluorescence intensities were calculated and the data normalized to the starting intensities as a percentage of the residue of surface label.

Similar articles

Cited by

References

    1. Kestler HW, III, Ringler DJ, Mori K, Panicali DL, Sehgal PK, Daniel MD, Desrosiers RC. Importance of the nef gene for maintenance of high virus loads and for development of AIDS. Cell. 1991;65:651–662. - PubMed
    1. Hanna Z, Kay DG, Rebai N, Guimond A, Jothy S, Jolicoeur P. Nef harbors a major determinant of pathogenicity for an AIDS-like disease induced by HIV-1 in transgenic mice. Cell. 1998;95:163–175. - PubMed
    1. Miller MD, Warmerdam MT, Gaston I, Greene WC, Feinberg MB. The human immunodeficiency virus-1 nef gene product: a positive factor for viral infection and replication in primary lymphocytes and macrophages. J Exp Med. 1994;179:101–113. - PMC - PubMed
    1. Das SR, Jameel S. Biology of the HIV Nef protein. Indian J Med Res. 2005;121:315–332. - PubMed
    1. Arold ST, Baur AS. Dynamic Nef and Nef dynamics: how structure could explain the complex activities of this small HIV protein. Trends Biochem Sci. 2001;26:356–363. - PubMed

Publication types

MeSH terms