

Development of a cell-based hepatitis C virus infection fluorescent resonance energy transfer assay for high-throughput antiviral compound screening
- PMID: 19620334
- PMCID: PMC2764155
- DOI: 10.1128/AAC.00495-09
Development of a cell-based hepatitis C virus infection fluorescent resonance energy transfer assay for high-throughput antiviral compound screening
Abstract
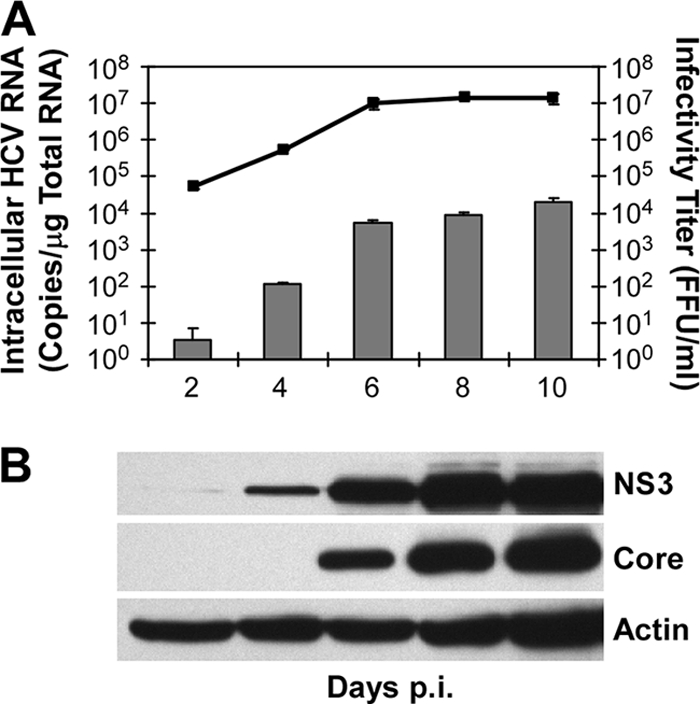
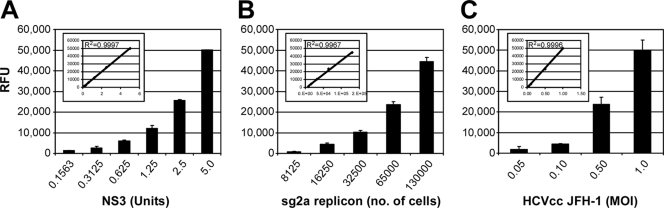
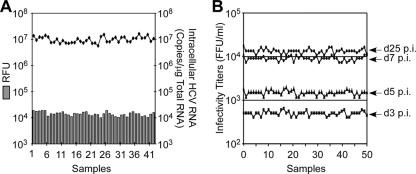
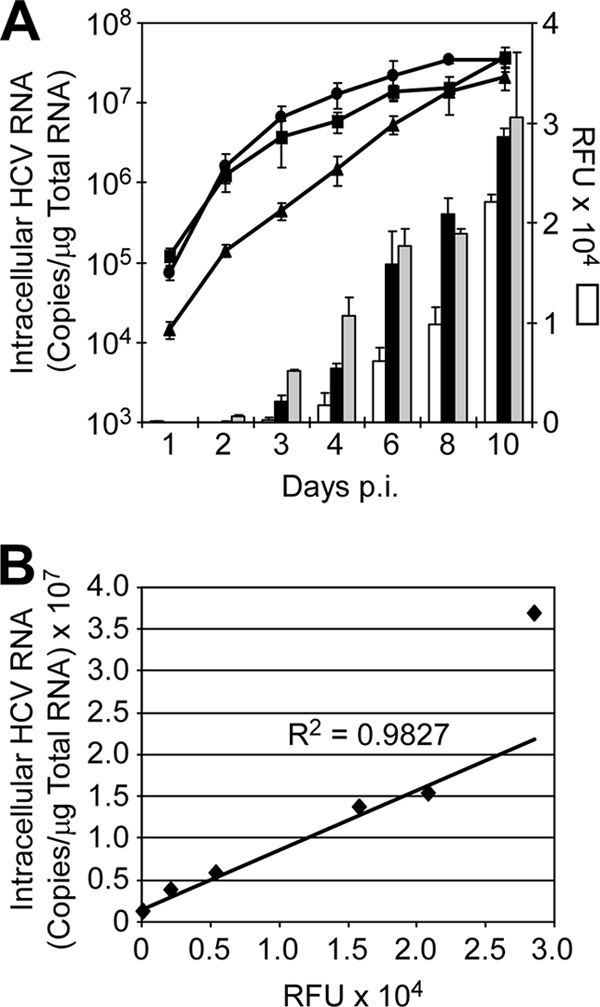
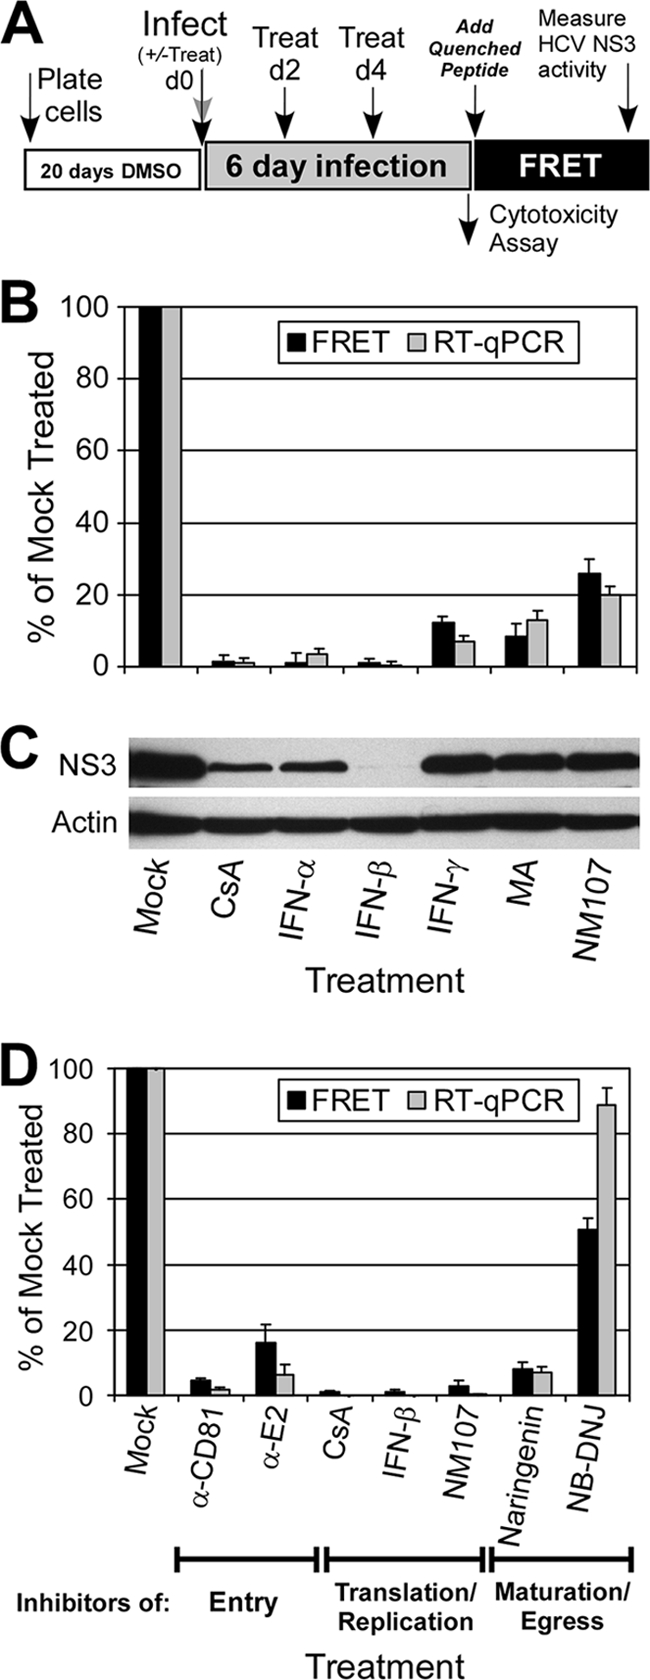
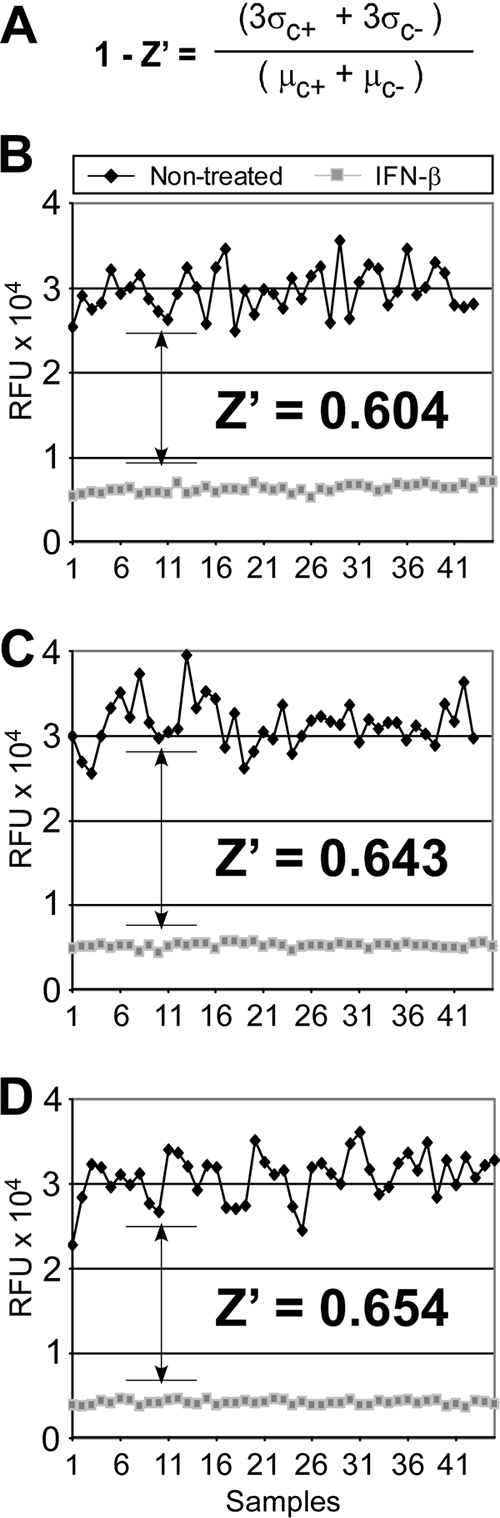
A major obstacle in the treatment of chronic hepatitis C virus (HCV) infection has been the lack of effective, well-tolerated therapeutics. Notably, the recent development of the HCV cell culture infection system now allows not only for the study of the entire viral life cycle, but also for the screening of inhibitors against all aspects of HCV infection. However, in order to screen libraries of potential antiviral compounds, it is necessary to develop a highly reproducible, accurate assay for HCV infection adaptable for high-throughput screening (HTS) automation. Using an internally quenched 5-FAM/QXL 520 fluorescence resonance energy transfer (FRET) substrate containing the HCV NS3 peptide cleavage sequence, we report the development of a simple, mix-and-measure, homogenous, cell-based HCV infection assay amendable for HTS. This assay makes use of synchronized, nondividing human hepatoma-derived Huh7 cells, which support more-reproducible long-term HCV infection and can be readily scaled down to a 96-well-plate format. We demonstrate that this stable cell culture method eliminates common problems associated with standard cell-based HTS, such as cell culture variability, poor reproducibility, and low signal intensity. Importantly, this HCV FRET assay not only can identify inhibitors that act throughout the viral life cycle as effectively as more-standard HCV assays, such as real-time quantitative PCR and Western blot analysis, but also exhibits a high degree of accuracy with limited signal variation (i.e., Z' > or = 0.6), providing the basis for a robust HTS campaign for screening compound libraries and identifying novel HCV antivirals.
Figures

Similar articles
-
Identification of hepatitis C virus inhibitors targeting different aspects of infection using a cell-based assay.Antimicrob Agents Chemother. 2012 Dec;56(12):6109-20. doi: 10.1128/AAC.01413-12. Epub 2012 Sep 4. Antimicrob Agents Chemother. 2012. PMID: 22948883 Free PMC article.
-
Cell-based hepatitis C virus infection fluorescence resonance energy transfer (FRET) assay for antiviral compound screening.Curr Protoc Microbiol. 2010 Aug;Chapter 17(1):Unit 17.5.. doi: 10.1002/9780471729259.mc1705s18. Curr Protoc Microbiol. 2010. PMID: 20812217 Free PMC article.
-
Development of a cell-based high-throughput specificity screen using a hepatitis C virus-bovine viral diarrhea virus dual replicon assay.Antimicrob Agents Chemother. 2005 Apr;49(4):1346-53. doi: 10.1128/AAC.49.4.1346-1353.2005. Antimicrob Agents Chemother. 2005. PMID: 15793110 Free PMC article.
-
Current status and future development of infectious cell-culture models for the major genotypes of hepatitis C virus: Essential tools in testing of antivirals and emerging vaccine strategies.Antiviral Res. 2018 Oct;158:264-287. doi: 10.1016/j.antiviral.2018.07.014. Epub 2018 Jul 27. Antiviral Res. 2018. PMID: 30059723 Review.
-
Direct-acting and host-targeting HCV inhibitors: current and future directions.Curr Opin Virol. 2012 Oct;2(5):588-98. doi: 10.1016/j.coviro.2012.08.002. Epub 2012 Sep 5. Curr Opin Virol. 2012. PMID: 22959589 Review.
Cited by
-
Identification of 23-(s)-2-amino-3-phenylpropanoyl-silybin as an antiviral agent for influenza A virus infection in vitro and in vivo.Antimicrob Agents Chemother. 2013 Sep;57(9):4433-43. doi: 10.1128/AAC.00759-13. Epub 2013 Jul 8. Antimicrob Agents Chemother. 2013. PMID: 23836164 Free PMC article.
-
New hepatitis C virus drug discovery strategies and model systems.Expert Opin Drug Discov. 2012 Sep;7(9):849-59. doi: 10.1517/17460441.2012.711312. Epub 2012 Aug 4. Expert Opin Drug Discov. 2012. PMID: 22861052 Free PMC article. Review.
-
Viral kinetics suggests a reconciliation of the disparate observations of the modulation of claudin-1 expression on cells exposed to hepatitis C virus.PLoS One. 2012;7(4):e36107. doi: 10.1371/journal.pone.0036107. Epub 2012 Apr 24. PLoS One. 2012. PMID: 22545157 Free PMC article.
-
RACK1 mediates rewiring of intracellular networks induced by hepatitis C virus infection.PLoS Pathog. 2019 Sep 16;15(9):e1008021. doi: 10.1371/journal.ppat.1008021. eCollection 2019 Sep. PLoS Pathog. 2019. PMID: 31525236 Free PMC article.
-
A cell protection screen reveals potent inhibitors of multiple stages of the hepatitis C virus life cycle.Proc Natl Acad Sci U S A. 2010 Feb 23;107(8):3764-9. doi: 10.1073/pnas.0915117107. Epub 2010 Feb 8. Proc Natl Acad Sci U S A. 2010. PMID: 20142494 Free PMC article.
References
-
- Ahmed, A., and E. B. Keeffe. 1999. Treatment strategies for chronic hepatitis C: update since the 1997 National Institutes of Health Consensus Development Conference. J. Gastroenterol. Hepatol. 14(Suppl.):S12-S8. - PubMed
-
- Alter, H. J., and L. B. Seeff. 2000. Recovery, persistence, and sequelae in hepatitis C virus infection: a perspective on long-term outcome. Semin. Liver Dis. 20:17-35. - PubMed
-
- Beames, B., D. Chavez, and R. E. Lanford. 2001. GB virus B as a model for hepatitis C virus. ILAR J. 42:152-160. - PubMed
-
- Bianchi, E., C. Steinkuhler, M. Taliani, A. Urbani, R. D. Francesco, and A. Pessi. 1996. Synthetic depsipeptide substrates for the assay of human hepatitis C virus protease. Anal. Biochem. 237:239-244. - PubMed
Publication types
MeSH terms
Substances
Grants and funding
LinkOut - more resources
Full Text Sources
Other Literature Sources
Medical
