. 2009 Oct;77(10):4631-42.
doi: 10.1128/IAI.00592-09. Epub 2009 Jul 20.

Quantitative comparison of active and latent tuberculosis in the cynomolgus macaque model

Affiliations

Quantitative comparison of active and latent tuberculosis in the cynomolgus macaque model

Philana Ling Lin et al. Infect Immun. 2009 Oct.

Abstract

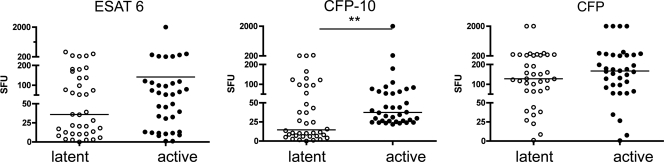
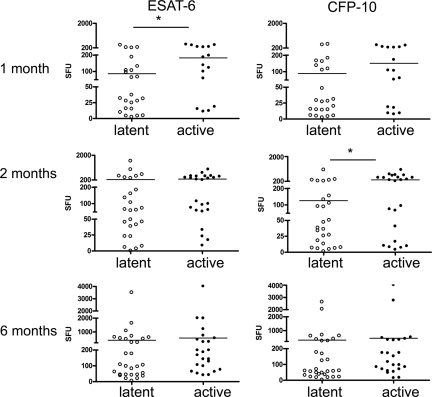
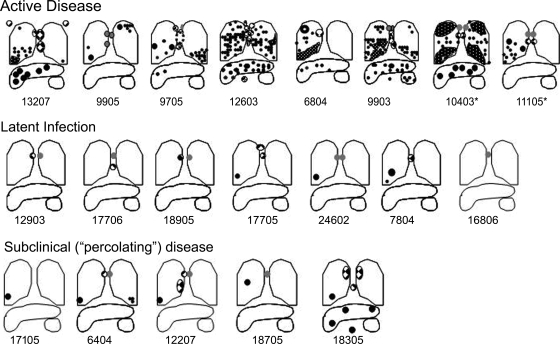
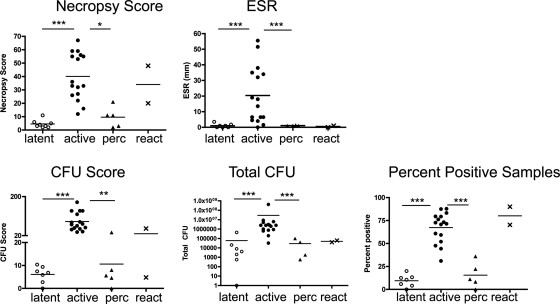
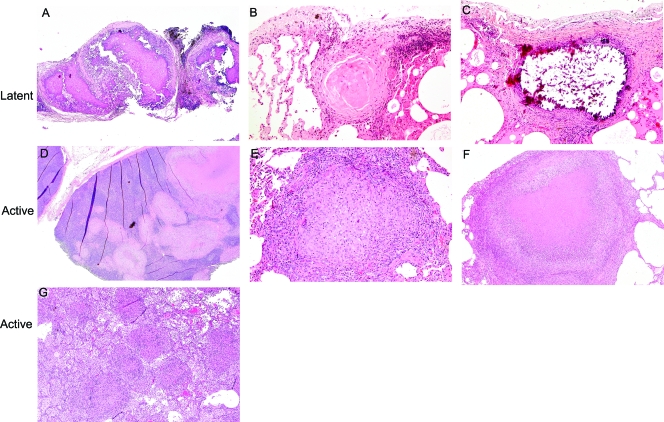
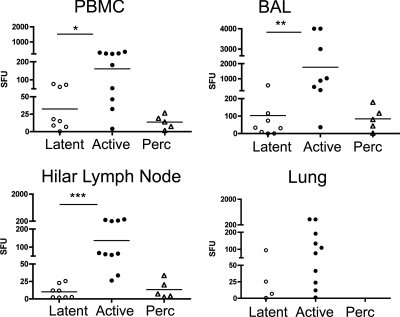
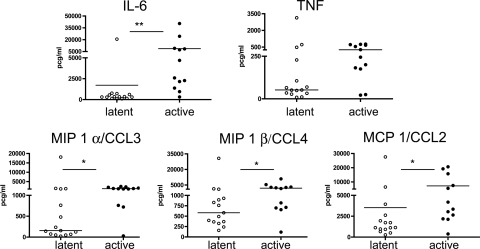
We previously described that low-dose Mycobacterium tuberculosis infection in cynomolgus macaques results in a spectrum of disease similar to that of human infection: primary disease, latent infection, and reactivation tuberculosis (S. V. Capuano III, D. A. Croix, S. Pawar, A. Zinovik, A. Myers, P. L. Lin, S. Bissel, C. Fuhrman, E. Klein, and J. L. Flynn, Infect. Immun. 71:5831-5844, 2003). This is the only established model of latent infection, and it provides a unique opportunity to understand host and pathogen differences across of range of disease states. Here, we provide a more extensive and detailed characterization of the gross pathology, microscopic histopathology, and immunologic characteristics of monkeys in each clinical disease category. The data underscore the similarities between human and nonhuman primate M. tuberculosis infection. Furthermore, we describe novel methods of quantifying gross pathology and bacterial burden that distinguish between active disease and latent infection, and we extend the usefulness of this model for comparative studies. Early in infection, an abnormal chest X ray, M. tuberculosis growth by gastric aspirate, and increased mycobacterium-specific gamma interferon (IFN-gamma) in peripheral blood mononuclear cells (PBMCs) and bronchoalveolar lavage (BAL) cells were associated with the development of active disease. At necropsy, disease was quantified with respect to pathology and bacterial numbers. Microscopically, a spectrum of granuloma types are seen and differ with disease type. At necropsy, monkeys with active disease had more lung T cells and more IFN-gamma from PBMC, BAL, and mediastinal lymph nodes than monkeys with latent infection. Finally, we have observed a spectrum of disease not only in monkeys with active disease but also in those with latent infection that provides insight into human latent tuberculosis.


Figures

FIG. 1.
FIG. 1.
Greater production of IFN-γ in response to CFP-10 is seen in PBMC at 6 weeks postinfection among monkeys who will develop active disease. Mycobacterium-specific IFN-γ production was measured in PBMC by the ELISPOT assay of monkeys who later would be classified as having active tuberculosis or latent infection. No difference in the production of IFN-γ was seen in PBMC stimulated with ESAT-6 peptide or CFP. ELISPOT assay results were measured in spot-forming units (SFU) per 200,000 cells. **, P < 0.01 by Mann-Whitney test; n = 38 for latently infected monkeys; n = 36 for active-disease monkeys.
FIG. 2.
FIG. 2.
Monkeys who develop active disease have a higher frequency of mycobacterium-specific IFN-γ-producing T cells in BAL cells during the first 2 months after M. tuberculosis infection. The ELISPOT assay was used to measured IFN-γ production in response to ESAT-6 and CFP-10 peptides at preinfection and at 1, 2, and 6 months postinfection. Monkeys who later would develop active disease had greater production of IFN-γ to ESAT-6 at 1 month postinfection and greater response to CFP-10 at 2 months postinfection than did those that would present with latent infection. No differences were observed at baseline or at 6 months postinfection. *, P < 0.05 by Mann-Whitney test. The measurement of IFN-γ by ELISPOT assay was quantified in spot-forming units (SFU) per 100,000 cells. n = 24 to 29 for latently infected monkeys; n = 16 to 24 for active-disease monkeys.
FIG. 3.
FIG. 3.
Active-disease monkeys have more gross pathology at necropsy than latently infected monkeys. The cartoon depiction of the gross disease demonstrates the presence of enlarged lymph nodes (gray circles), granulomatous lymph nodes (checkered circles), and granulomas (black circles) in the lungs, lymph nodes, and extrapulmonary sites (liver and spleen). Cavitary disease is represented by a thick circle (upper lobe of 6804). Monkeys with active disease demonstrate a wide spectrum of disease involvement that includes the lung and thoracic lymph nodes and also can involve liver and spleen (e.g., 9903). Tuberculous pneumonia is observed to occur in the lungs of some active-disease monkeys (white dotted pattern on black in lung lobes), such as in the bilateral upper and lower lobes of 10403. In contrast, latently infected monkeys have limited disease consisting of, at a minimum, lymph node involvement and sometimes the granuloma involvement of the lung. No extrapulmonary disease is seen in latent infection. Subclinical percolating monkeys had disease that was limited to the lung and lymph node in the same pattern as that of latently infected monkeys, with one exception (18305). Monkeys who had latent infection and developed spontaneous reactivation are indicated by an asterisk.
FIG. 4.
FIG. 4.
Monkeys with active disease have higher ESRs, necropsy scores, bacterial burdens, and dissemination than latently infected and subclinical percolator monkeys. The necropsy score is based on the size and frequency of tuberculous lesions in the lung, mediastinal lymph nodes, and abdominal viscera prospectively identified at the time of necropsy. Bacterial burden is measured first by the CFU score, which is derived by the sum of the log-transformed CFU per gram of tissue plated at the time of necropsy as a method of measuring the overall bacterial burden and by the summation of CFU per gram of tissue for all samples (Total CFU). The distribution of bacterial growth (dissemination) is measured by calculating the overall percentage of samples in which M. tuberculosis was detected at necropsy. ESR and percent-positive samples were analyzed by ANOVA with Bonferroni's post hoc analysis, whereas all other parameters were measured by Kruskal-Wallis with Dunn's multiple-comparison post hoc analysis. *, P < 0.05; **, P < 0.01; ***, P < 0.001; n = 16 for active-disease monkeys, 8 for latently infected monkeys, 5 for percolator monkeys, and 2 for reactivator monkeys.
FIG. 5.
FIG. 5.
Microscopic histopathology of tuberculosis in the cynomolgus macaque model demonstrates a spectrum of lesion types. (A) The hilar lymph node of a latently infected monkey demonstrates the complete effacement of nodal architecture, which is replaced by mineralized material (magnification, ×5; hematoxylin and eosin staining [H&E] was used). (B) A sclerotic granuloma, characterized by centrally located sclerotic collagenous material with scant cellular components, from the lung of a latently infected monkey (magnification, ×10; H&E). (C) A mineralized granuloma from the lung of a latently infected monkey. Mineral is noted in the center of the granuloma (resulting in artifactual shattering of material), surrounded by a periphery of lymphoplasmacytic cells (magnification, ×10; H&E). (D) A multifocal pattern of both caseous and nonnecrotizing granulomas infiltrating the architecture of a hilar/mediastinal lymph node from an active-disease monkey (magnification, ×2; H&E). (E) A well-circumscribed nonnecrotic (solid cellular) granuloma consisting of centrally located epithelioid macrophages and peripheral lymphocytes from the right lower lobe of an active-disease monkey (magnification, ×5; H&E). (F) A caseous granuloma consisting of a central area of amorphous eosinophilic caseum surrounded by a mantle of pallisading epithelioid macrophages and peripherally located lymphocytic cuff from an active-disease monkey (magnification, ×5; H&E). (G) Tuberculous pneumonia in the lung of an active-disease monkey in which both caseous and nonnecrotizing granulomas are seen with surrounding inflammatory cells (macrophages, neutrophils, and lymphocytes) invading into the alveolar lung structures (magnification, ×10; H&E).
FIG. 6.
FIG. 6.
Greater IFN-γ production in response to ESAT-6 and CFP-10 peptides in active-disease monkeys in the PBMC, BAL cells, and hilar lymph node cells at necropsy. Spot-forming units in this figure represent the summation of responses to peptide pools of ESAT-6 and CFP-10. Too few lung samples with sufficient T cells were obtained from latently infected monkeys to allow statistical analyses. Subclinical percolating monkeys had results that were similar to those of latently infected monkeys, suggesting that they exhibit a spectrum of latent infection. ELISPOT assay results are shown as spot-forming units (SFU). *, P < 0.05; **, P < 0.01; ***, P < 0.001 (all by Mann-Whitney test).
FIG. 7.
FIG. 7.
Higher production of certain cytokines and chemokines in the lungs of active-disease monkeys than in those of latently infected monkeys. Cytokine and chemokine levels were determined by a Luminex analysis of tissue homogenates. TNF production appeared to be greater in the lungs of active-disease monkeys, although this did not reach statistical significance (P = 0.067). *, P < 0.05; **, P < 0.01; ***, P < 0.001 (all by Mann-Whitney test).

References

    1. Barnes, P. F., T. D. Verdegem, L. A. Vachon, J. M. Leedom, and G. D. Overturf. 1988. Chest roentgenogram in pulmonary tuberculosis. New data on an old test. Chest 94:316-320. - PubMed
    1. Canetti, G. 1955. The tubercle bacillus. Springer Publishing Co., Inc., New York, NY.
    1. Capuano, S. V., III, D. A. Croix, S. Pawar, A. Zinovik, A. Myers, P. L. Lin, S. Bissel, C. Fuhrman, E. Klein, and J. L. Flynn. 2003. Experimental Mycobacterium tuberculosis infection of cynomolgus macaques closely resembles the various manifestations of human M. tuberculosis infection. Infect. Immun. 71:5831-5844. - PMC - PubMed
    1. Chee, C. B., T. M. Barkham, K. W. Khinmar, S. H. Gan, and Y. T. Wang. 2008. Quantitative T-cell interferon-gamma responses to Mycobacterium tuberculosis-specific antigens in active and latent tuberculosis. Eur. J. Clin. Microbiol. Infect. Dis. 28:667-670. - PubMed
    1. Doherty, T. M., A. Demissie, J. Olobo, D. Wolday, S. Britton, T. Eguale, P. Ravn, and P. Andersen. 2002. Immune responses to the Mycobacterium tuberculosis-specific antigen ESAT-6 signal subclinical infection among contacts of tuberculosis patients. J. Clin. Microbiol. 40:704-706. - PMC - PubMed

Publication types

MeSH terms

Substances