The Duffy-null state is associated with a survival advantage in leukopenic HIV-infected persons of African ancestry
- PMID: 19620399
- PMCID: PMC2927046
- DOI: 10.1182/blood-2009-04-215186
The Duffy-null state is associated with a survival advantage in leukopenic HIV-infected persons of African ancestry
Abstract
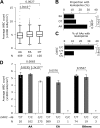
Persons of African ancestry, on average, have lower white blood cell (WBC) counts than those of European descent (ethnic leukopenia), but whether this impacts negatively on HIV-1 disease course remains unknown. Here, in a large natural history cohort of HIV-infected subjects, we show that, although leukopenia (< 4000 WBC/mm(3) during infection) was associated with an accelerated HIV disease course, this effect was more prominent in leukopenic subjects of European than African ancestry. The African-specific -46C/C genotype of Duffy Antigen Receptor for Chemokines (DARC) confers the malaria-resisting, Duffy-null phenotype, and we found that the recently described association of this genotype with ethnic leukopenia extends to HIV-infected African Americans (AAs). The association of Duffy-null status with HIV disease course differed according to WBC but not CD4(+) T-cell counts, such that leukopenic but not nonleukopenic HIV(+) AAs with DARC -46C/C had a survival advantage compared with all Duffy-positive subjects. This survival advantage became increasingly pronounced in those with progressively lower WBC counts. These data highlight that the interaction between DARC genotype and the cellular milieu defined by WBC counts may influence HIV disease course, and this may provide a partial explanation of why ethnic leukopenia remains benign in HIV-infected AAs, despite immunodeficiency.
Figures


Comment in
-
HIV: getting to the heart of DARCness.Blood. 2009 Sep 24;114(13):2570-1. doi: 10.1182/blood-2009-08-235556. Blood. 2009. PMID: 19779045 No abstract available.
Similar articles
-
Neutrophil Effector Functions Are Not Impaired in Duffy Antigen Receptor for Chemokines (DARC)-Null Black South Africans.Front Immunol. 2019 Mar 26;10:551. doi: 10.3389/fimmu.2019.00551. eCollection 2019. Front Immunol. 2019. PMID: 30972057 Free PMC article.
-
Lack of Duffy antigen receptor for chemokines: no influence on HIV disease progression in an African treatment-naive population.Cell Host Microbe. 2009 May 8;5(5):413-5; author reply 418-9. doi: 10.1016/j.chom.2009.04.009. Cell Host Microbe. 2009. PMID: 19454341 Free PMC article. No abstract available.
-
Duffy-null-associated low neutrophil counts influence HIV-1 susceptibility in high-risk South African black women.Clin Infect Dis. 2011 May;52(10):1248-56. doi: 10.1093/cid/cir119. Clin Infect Dis. 2011. PMID: 21507922 Free PMC article.
-
The Duffy antigen receptor for chemokines, ACKR1,- 'Jeanne DARC' of benign neutropenia.Br J Haematol. 2019 Feb;184(4):497-507. doi: 10.1111/bjh.15730. Epub 2018 Dec 27. Br J Haematol. 2019. PMID: 30592023 Review.
-
Neutrophil counts in persons of African origin.Curr Opin Hematol. 2014 Jan;21(1):50-7. doi: 10.1097/MOH.0000000000000007. Curr Opin Hematol. 2014. PMID: 24257098 Review.
Cited by
-
Using whole-genome sequencing to characterize clinically significant blood groups among healthy older Australians.Blood Adv. 2022 Aug 9;6(15):4593-4604. doi: 10.1182/bloodadvances.2022007505. Blood Adv. 2022. PMID: 35420653 Free PMC article.
-
Immune regulation by atypical chemokine receptors.Nat Rev Immunol. 2013 Nov;13(11):815-29. doi: 10.1038/nri3544. Nat Rev Immunol. 2013. PMID: 24319779 Review.
-
Benign ethnic neutropenia.Blood Rev. 2019 Sep;37:100586. doi: 10.1016/j.blre.2019.06.003. Epub 2019 Jun 21. Blood Rev. 2019. PMID: 31255364 Free PMC article. Review.
-
Novel neutrophil biology insights underlying atypical chemokine receptor-1/Duffy antigen receptor of chemokines-associated neutropenia.Curr Opin Hematol. 2024 Nov 1;31(6):302-306. doi: 10.1097/MOH.0000000000000834. Epub 2024 Jul 24. Curr Opin Hematol. 2024. PMID: 39045882 Free PMC article. Review.
-
Blood Groups in Infection and Host Susceptibility.Clin Microbiol Rev. 2015 Jul;28(3):801-70. doi: 10.1128/CMR.00109-14. Clin Microbiol Rev. 2015. PMID: 26085552 Free PMC article. Review.
References
-
- Kaslow RA, Phair JP, Friedman HB, et al. Infection with the human immunodeficiency virus: clinical manifestations and their relationship to immune deficiency. A report from the Multicenter AIDS Cohort Study. Ann Intern Med. 1987;107:474–480. - PubMed
-
- Levine AM, Karim R, Mack W, et al. Neutropenia in human immunodeficiency virus infection: data from the women's interagency HIV study. Arch Intern Med. 2006;166:405–410. - PubMed
-
- Farber BF, Lesser M, Kaplan MH, Woltmann J, Napolitano B, Armellino D. Clinical significance of neutropenia in patients with human immunodeficiency virus infection. Infect Control Hosp Epidemiol. 1991;12:429–434. - PubMed
-
- D'Angelo LJ, Getson PR, Luban NL, Gayle HD. Human immunodeficiency virus infection in urban adolescents: can we predict who is at risk? Pediatrics. 1991;88:982–986. - PubMed
Publication types
MeSH terms
Substances
Grants and funding
LinkOut - more resources
Full Text Sources
Medical
Research Materials

