

Review
doi: 10.2214/AJR.09.2869.
Imaging of tumor angiogenesis: functional or targeted?
Affiliations
- PMID: 19620425
- PMCID: PMC3523171
- DOI: 10.2214/AJR.09.2869
Item in Clipboard
Review
Imaging of tumor angiogenesis: functional or targeted?
AJR Am J Roentgenol.
2009 Aug.
Abstract
Objective: Angiogenesis--the growth of new vessels--is both a normal physiologic response and a critical step in many pathologic processes, particularly cancer. Imaging has long relied on the different enhancement characteristics of cancer compared with normal tissue; the information generated is often primarily morphologic and qualitative. However, more quantitative methods based on functional and targeted imaging have recently emerged.
Conclusion: In this article, we review both functional and targeted imaging techniques for assessing tumor angiogenesis.
Figures
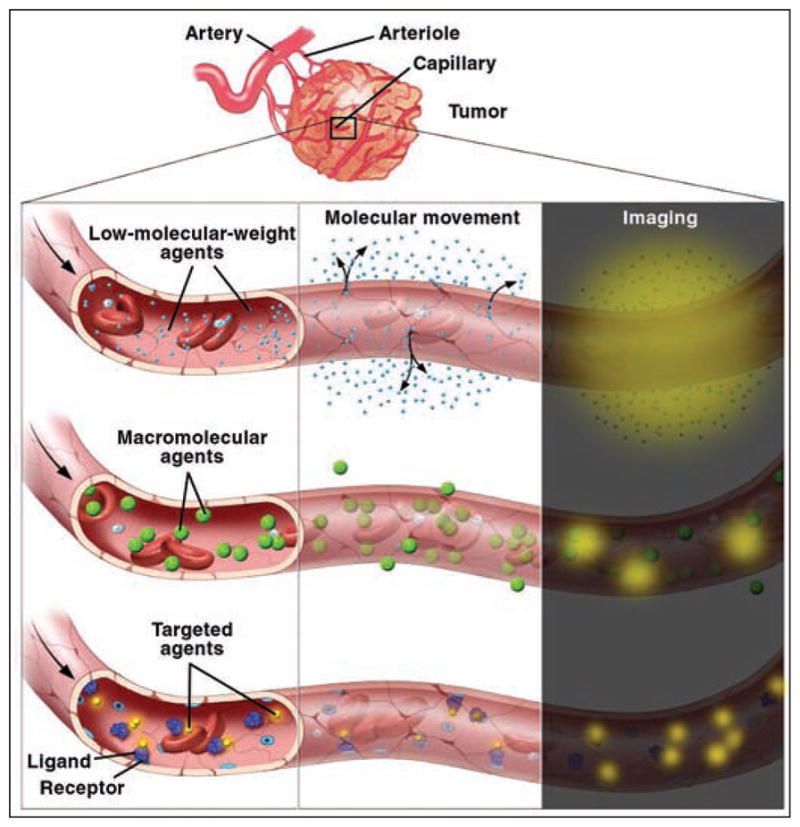
Illustration of low-molecular-weight, macromolecular, and targeted contrast agents diffusing from tumor vessels into interstitial space. Courtesy of Lydia V. Kibiuk, NIH/DMA.
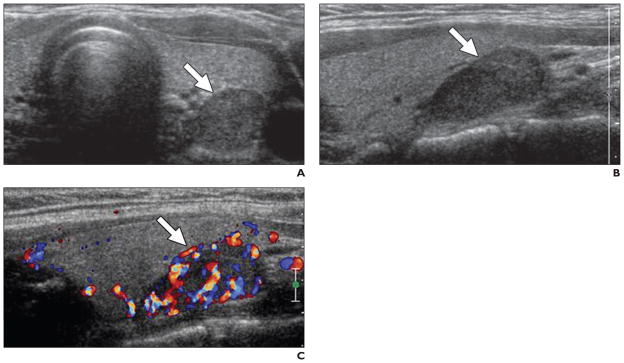
A, Axial gray-scale ultrasound image obtained with conventional probe shows hypoechoic lesion at left inferior thyroid bed (arrow). B, Sagittal gray-scale ultrasound image with high-resolution probe confirms presence of lesion (arrow). C, Lesion shows increased vascularity at color Doppler mode, consistent with parathyroid adenoma (arrow).
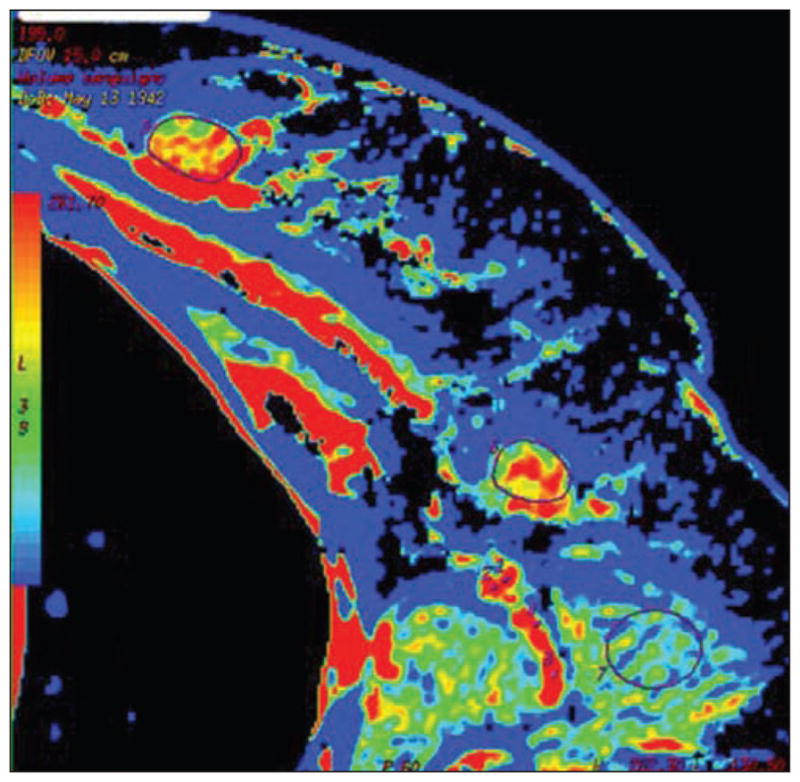
Colored map of blood volume obtained by CT perfusion in female patient with breast cancer and ipsilateral palpable node. Both primary tumor (outlined by region of interest [ROI]) and target node (outlined by ROI) are visible on this slice. High values of blood volume are depicted both in primary tumor and in target node. At postsurgical pathology, lymph node was determined to be metastatic. (Reprinted with permission from Liu Y, Bellomi M, Gatti G, Ping X. Accuracy of computed tomography perfusion in assessing metastatic involvement of enlarged axillary lymph nodes in patients with breast cancer. Breast Cancer Res 2007; 9:R40 [80])
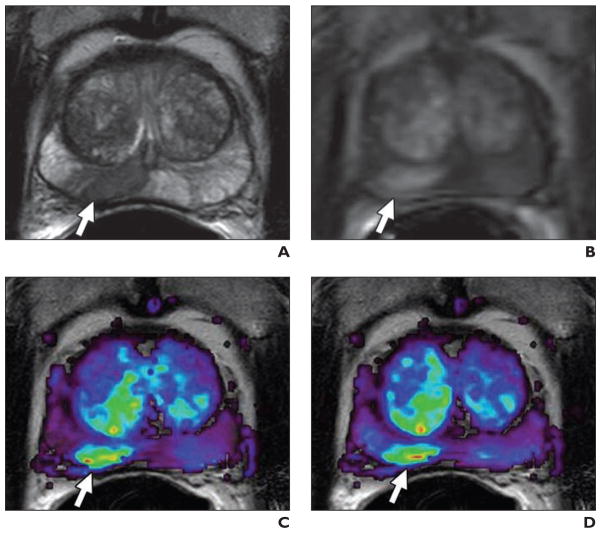
A, Axial T2-weighted MR image shows low-signal-intensity foci suspicious for prostate cancer at right mid peripheral zone (arrow). B, Raw dynamic contrast-enhanced MR image shows significant enhancement of lesion (arrow). C and D, Corresponding Ktrans (transendothelial transport of contrast medium from vascular compartment to the tumor interstitium) (C) and kep (reverse transport parameter of contrast medium back into the vascular space) (D) maps localize right peripheral zone tumor (arrows).
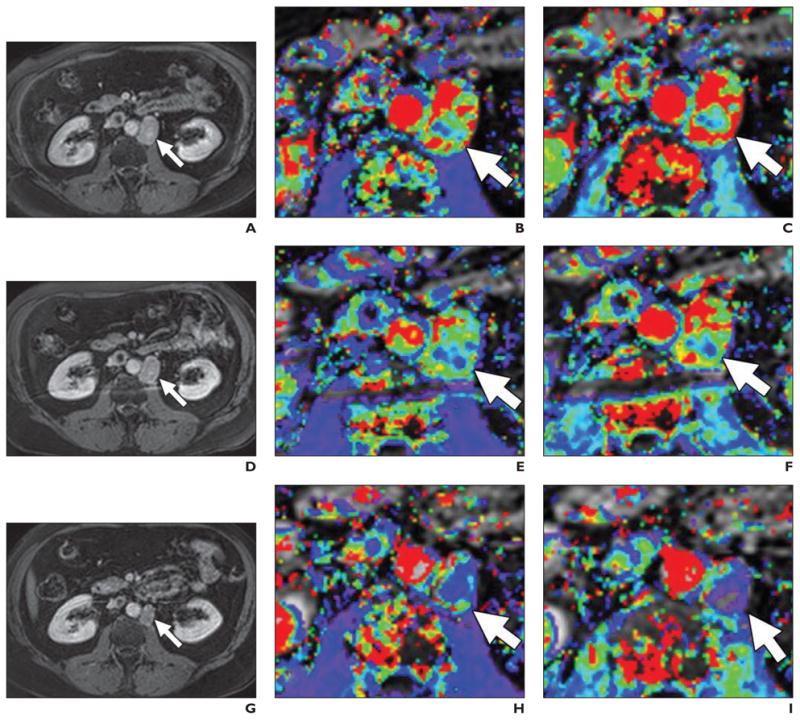
A–I, T1-weighted delayed contrast-enhanced MR images (A, D, and G), magnified Ktrans (transendothelial transport of contrast medium from vascular compartment to the tumor interstitium) maps (B, E, H), and kep (reverse transport parameter of contrast medium back into the vascular space) maps (C, F, and I) before (top row), 24 hours after (middle row), and 1 month after (bottom row) antiangiogenesis therapy. Ktrans and kep reductions are seen in retroperitoneal lymph node (arrows) despite relatively little change in node size.
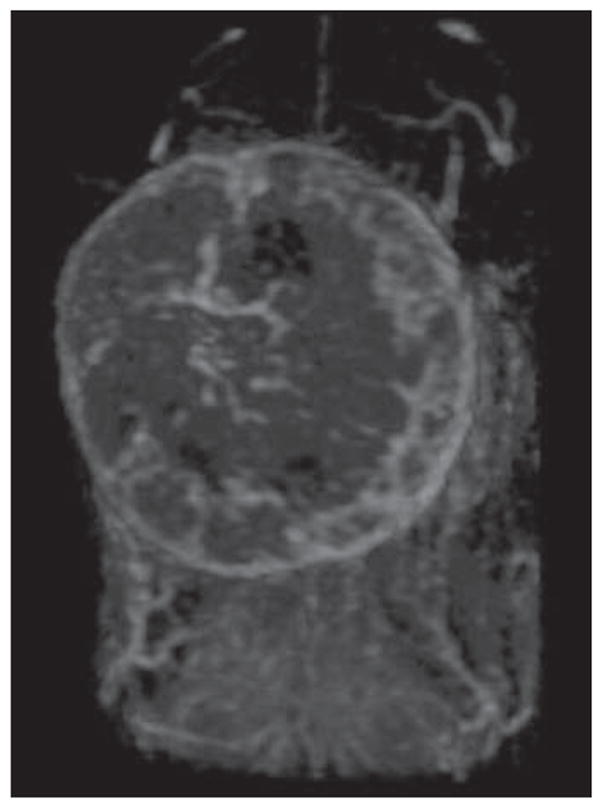
Three-dimensional dynamic contrast-enhanced MR image of orthotopically implanted breast cancer model produced with TUBO mice mammary breast cancer cell lines obtained 5 minutes after injection of 0.03 mmol Gd/kg of G6 (generation 6) dendrimer contrast agent via tail vein. Maximum-intensity- projection image cropped at site of breast tumor shows vascularity of tumor.
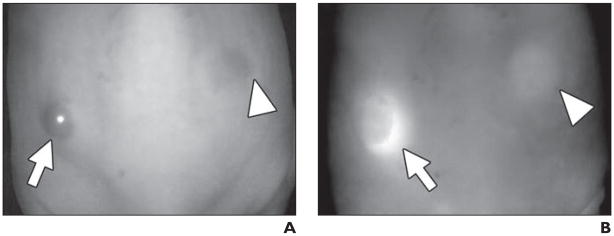
In vivo spectral fluorescence images obtained 4 days after injection of nonspecific blood pool agent, polyclonal IgG-Cy5.5 (50 μg, IV) into ATAC4 (left dorsum) (arrow) and A431 (right dorsum) (arrowhead) tumors in mice. A (white light image) and B (Cy5.5 fluorescence image), IgG-Cy5.5 similarly accumulated in both tumors and also showed mouse body because of blood pool.
References
-
- Folkman J. Tumor angiogenesis: therapeutic implications. N Engl J Med. 1971;18:1182–1186. - PubMed
-
- Bergers G, Benjamin LE. Tumorigenesis and the angiogenic switch. Nat Rev Cancer. 2003;3:401– 410. - PubMed
-
- Cosgrove D. Angiogenesis imaging: ultrasound. Br J Radiol. 2003;76(spec no 1):S43–S49. - PubMed
-
- Hata K, Nagami H, Iida K, Miyazaki K, Collins WP. Expression of thymidine phosphorylase in malignant ovarian tumors: correlation with microvessel density and an ultrasound-derived index of angiogenesis. Ultrasound Obstet Gynecol. 1998;12:201–206. - PubMed
-
- Yang WT, Tse GM, Lam PK, Metreweli C, Chang J. Correlation between color power Doppler sonographic measurement of breast tumor vasculature and immunohistochemical analysis of microvessel density for the quantitation of angiogenesis. J Ultrasound Med. 2002;21:1227–1235. - PubMed
Publication types
MeSH terms
Substances
Grants and funding
LinkOut - more resources
Full Text Sources
Other Literature Sources
Medical
