

Review
doi: 10.2214/AJR.09.3107.
In vivo MRI cell tracking: clinical studies
Affiliations
- PMID: 19620426
- PMCID: PMC2857985
- DOI: 10.2214/AJR.09.3107
Item in Clipboard
Review
In vivo MRI cell tracking: clinical studies
AJR Am J Roentgenol.
2009 Aug.
Abstract
Objective: The purpose of this review is to describe the principles of MRI cell tracking with superparamagnetic iron oxides and the four clinical trials that have been performed.
Conclusion: Clinical MRI cell tracking is likely to become an important tool at the bedside once (stem) cell therapy becomes mainstream. The most prominent role of this technique probably will be verification of accurate cell delivery with MRI-guided injection, in which interventional radiologists will play a role in the near future. All clinical studies described as of this writing have been performed outside the United States.
Figures
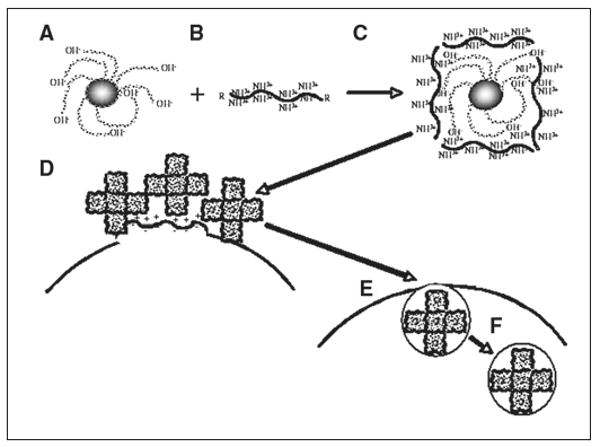
Schematic shows intracellular magnetic labeling with ferumoxides and polycationic transfection agent. Ferumoxides solution is supplied as formulation containing dextran as stabilizer (A). This bacterial polysaccharide has many terminal hydroxyl groups, which endow particles with negative surface charge (zeta potential, approximately −41 mV [54]). Commonly used (commercial) cationic transfection agents have zeta potential of +25 to +65 mV (B) and often contain multiple lysine or arginine residues and, as single agents, are known as cell-penetrating peptides. When mixed at correct concentration and incubated for approximately 60 minutes, A and B form complexes through electrostatic interactions, or van der Waals forces (C). Bond is not covalent but strong enough to hold two compounds together. Depending on ratio of ferumoxides to transfection agent, different sizes of oligomers form. Excess of either one results in formation of precipitable aggregates unsuitable for labeling. In this hypothetic example, oligomers consist of five individual ferumoxides particles, but there can be fewer or more. When added to cell cultures, ferumoxides–transfection agent complexes, which have net cationic charge due to outer coating of transfection agent, bind to anionic outer cell membrane (D), again as result of electrostatic interactions. As in macropinocytosis (big drinkers), membrane destabilization occurs through multiple membrane bends and invaginations (E). Membrane bending and cell-penetrating peptide properties of transfection agent ensure that ferumoxides complexes enter cells, eventually ending up in endosomes (F), which can fuse with secondary lysosomes.
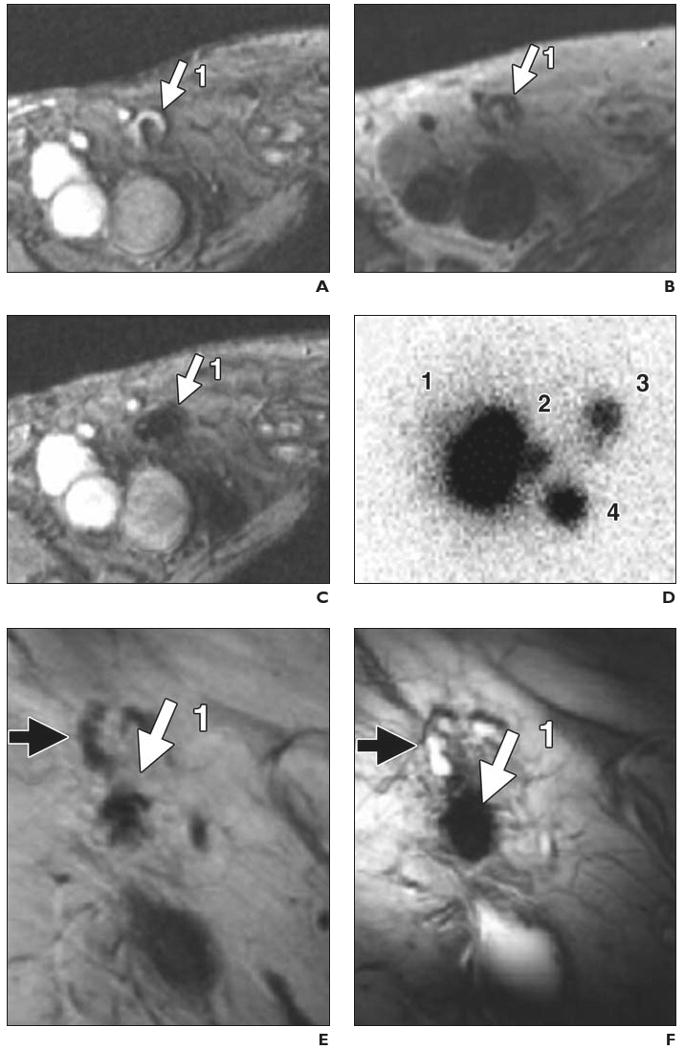
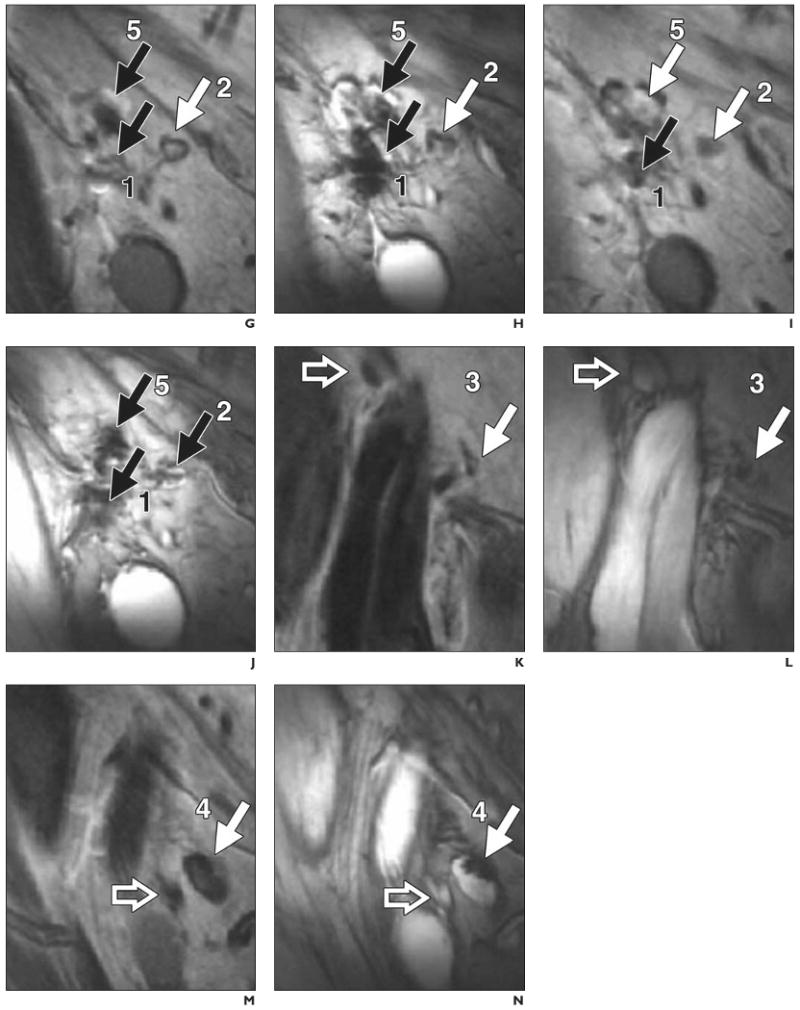
74-year-old man with stage III melanoma who had undergone intranodal injection of autologous dendritic cells primed with synthetic melanoma antigens and labeled with ferumoxides and 111In-oxine. In vivo migration of superparamagnetic iron oxide and 111In-labeled dendritic cells was monitored (D–N) with MRI and scintigraphy after injection into right inguinal lymph node. Overall, MRI had better accuracy for determining number and location of lymph nodes that contained injected or migrating labeled dendritic cells. (Reprinted with permission from [25]) A, Gradient-echo MR image before vaccination shows right inguinal lymph node (1, arrow) with area of high signal intensity. B, Spin-echo MR image shows lymph node (1, arrow) after vaccination. C, Gradient-echo MR image shows decreased signal intensity of lymph node (1, arrow) after vaccination. D, Scintigram obtained 2 days after vaccination shows migration of dendritic cells from injection lymph node (1) to three nearby lymph nodes (2–4). Lymph node identified at scintigraphy as injection lymph node (1) was found at MRI to consist of two distinct lymph nodes (1 and 5, G–J). E and F, Spin-echo (E) and gradient-echo (F) MR images show injection lymph node (1, solid arrow) 2 days after vaccination. Open arrow indicates lymph node that does not contain ferumoxides-labeled dendritic cells. G–N, Paired spin-echo (G, I, K, and M) and gradient-echo (H, J, L, and N) MR images show migration of dendritic cells from injection lymph node (1) to four nearby lymph nodes (2–5, solid arrows). Open arrows (K–N) indicate lymph nodes that do not contain ferumoxides-labeled dendritic cells; black solid arrows, lymph nodes positive for ferumoxides-labeled cells that have lower signal intensity on gradient-echo than on spin-echo images.
74-year-old man with stage III melanoma who had undergone intranodal injection of autologous dendritic cells primed with synthetic melanoma antigens and labeled with ferumoxides and 111In-oxine. In vivo migration of superparamagnetic iron oxide and 111In-labeled dendritic cells was monitored (D–N) with MRI and scintigraphy after injection into right inguinal lymph node. Overall, MRI had better accuracy for determining number and location of lymph nodes that contained injected or migrating labeled dendritic cells. (Reprinted with permission from [25]) A, Gradient-echo MR image before vaccination shows right inguinal lymph node (1, arrow) with area of high signal intensity. B, Spin-echo MR image shows lymph node (1, arrow) after vaccination. C, Gradient-echo MR image shows decreased signal intensity of lymph node (1, arrow) after vaccination. D, Scintigram obtained 2 days after vaccination shows migration of dendritic cells from injection lymph node (1) to three nearby lymph nodes (2–4). Lymph node identified at scintigraphy as injection lymph node (1) was found at MRI to consist of two distinct lymph nodes (1 and 5, G–J). E and F, Spin-echo (E) and gradient-echo (F) MR images show injection lymph node (1, solid arrow) 2 days after vaccination. Open arrow indicates lymph node that does not contain ferumoxides-labeled dendritic cells. G–N, Paired spin-echo (G, I, K, and M) and gradient-echo (H, J, L, and N) MR images show migration of dendritic cells from injection lymph node (1) to four nearby lymph nodes (2–5, solid arrows). Open arrows (K–N) indicate lymph nodes that do not contain ferumoxides-labeled dendritic cells; black solid arrows, lymph nodes positive for ferumoxides-labeled cells that have lower signal intensity on gradient-echo than on spin-echo images.
35-year-old woman with stage III melanoma. Accuracy of delivery of ferumoxides and 111In-oxine-labeled dendritic cells. (Adapted with permission from [25]) A, MR image obtained before vaccination shows inguinal lymph node (arrow) as target for injection. B, MR image obtained after injection shows site of accidental misinjection of labeled dendritic cells into subcutaneous fat (white arrow). Black arrow indicates lymph node that was intended target. C, Scintigraphic image, because of lack of anatomic information, does not show accurate injection (arrow).
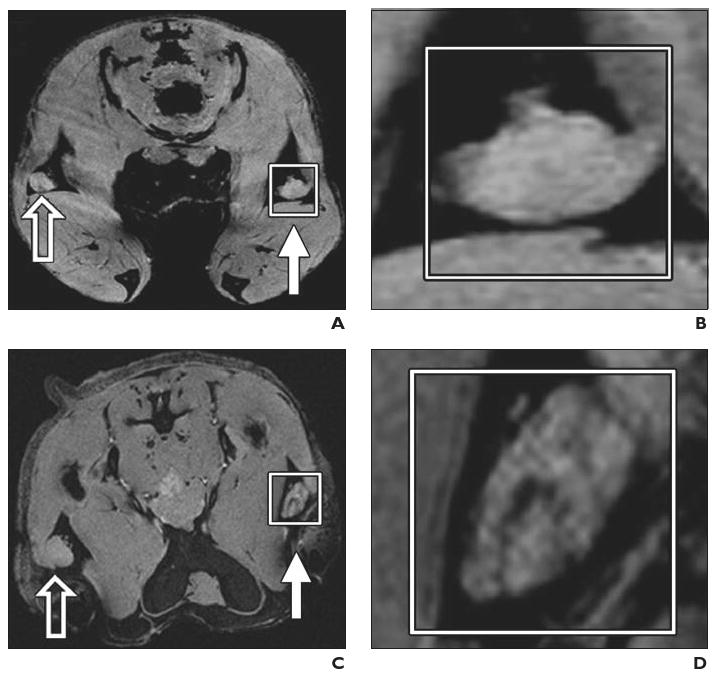
Experimental mouse model. Preclinical example of magnetovaccination for MRI tracking of injected dendritic cells. Dendritic cells were labeled in vivo (in situ) after phagocytosis of granulocyte–macrophage colony-stimulating factor (GM-CSF) tumor cell vaccine injected into footpad of mouse. Open arrows indicate draining popliteal lymph nodes from footpads with unlabeled GM-CSF vaccine; white arrows, draining popliteal lymph nodes from footpads with ferumoxides-labeled GM-CSF vaccine. (Reprinted with permission from [34]) A and B, Gradient-echo MR image (A) and magnification of inset (B) on day 1 show neither popliteal lymph node exhibits evidence of low signal intensity or dendritic cell homing to lymph nodes. C and D, Gradient-echo MR image (C) and magnification of inset (D) on day 3 show decreased signal intensity in lymph nodes that corresponds to arrival of sentinel dendritic cells that have captured antigen from ferumoxides-labeled vaccine. E and F, Gradient-echo MR image (E) and magnification of inset (F) show low signal intensity of lymph nodes persists on day 4. G and H, Gradient-echo MR image (G) and magnification of inset (H) on day 8 show increase in signal intensity with dynamic anatomic change suggesting redistribution of dendritic cells from lymph node cortex to medulla.
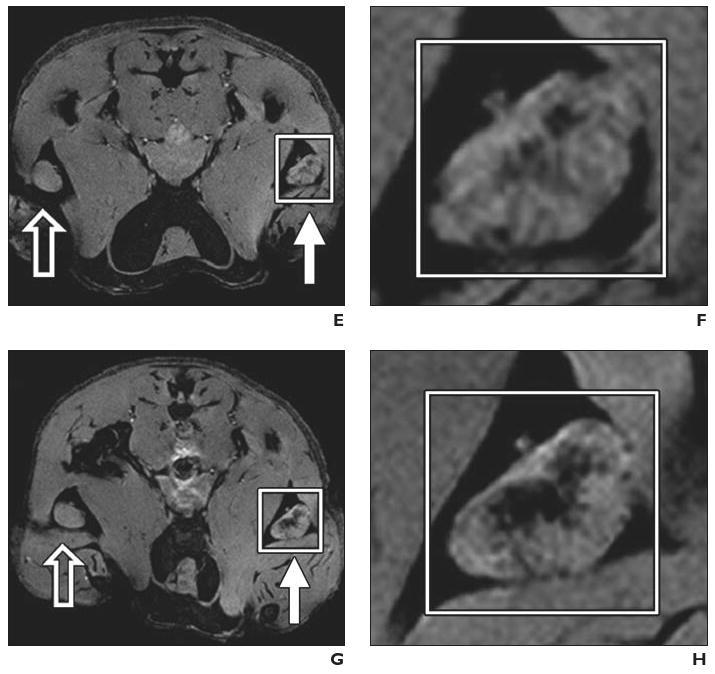
Experimental mouse model. Preclinical example of magnetovaccination for MRI tracking of injected dendritic cells. Dendritic cells were labeled in vivo (in situ) after phagocytosis of granulocyte–macrophage colony-stimulating factor (GM-CSF) tumor cell vaccine injected into footpad of mouse. Open arrows indicate draining popliteal lymph nodes from footpads with unlabeled GM-CSF vaccine; white arrows, draining popliteal lymph nodes from footpads with ferumoxides-labeled GM-CSF vaccine. (Reprinted with permission from [34]) A and B, Gradient-echo MR image (A) and magnification of inset (B) on day 1 show neither popliteal lymph node exhibits evidence of low signal intensity or dendritic cell homing to lymph nodes. C and D, Gradient-echo MR image (C) and magnification of inset (D) on day 3 show decreased signal intensity in lymph nodes that corresponds to arrival of sentinel dendritic cells that have captured antigen from ferumoxides-labeled vaccine. E and F, Gradient-echo MR image (E) and magnification of inset (F) show low signal intensity of lymph nodes persists on day 4. G and H, Gradient-echo MR image (G) and magnification of inset (H) on day 8 show increase in signal intensity with dynamic anatomic change suggesting redistribution of dendritic cells from lymph node cortex to medulla.
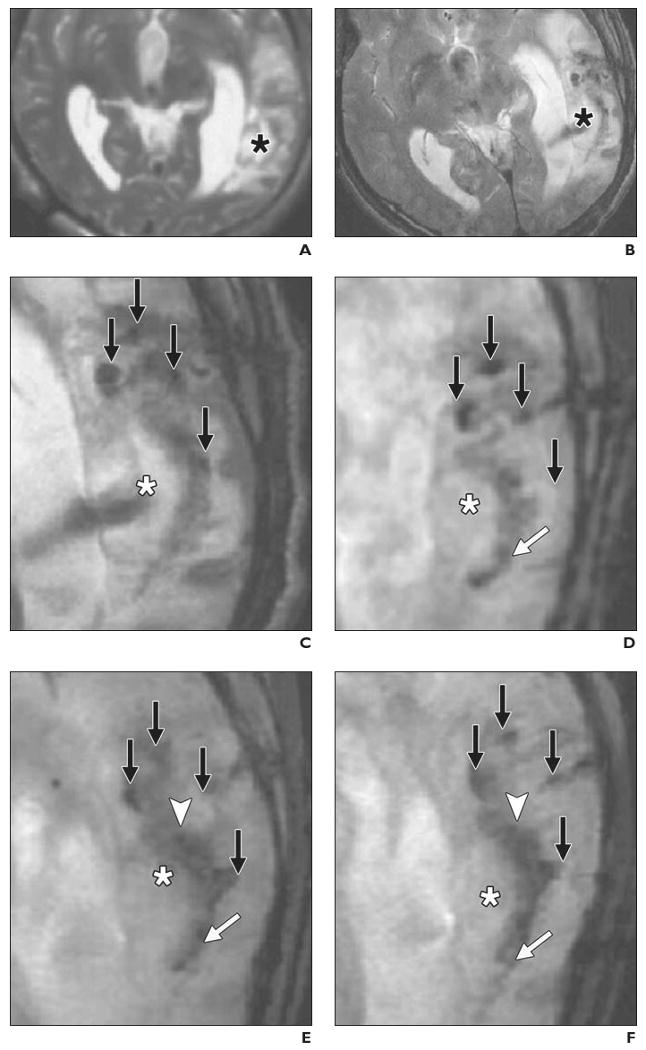
34-year-old man with traumatic brain injury (A–F) who received stereotactic injection of ferumoxides-labeled neural stem cells and 42-year-old man with traumatic brain injury (G–L) who received unlabeled autologous neural stem cells. MRI performed at 3 T. (Reprinted with permission from [26]) A, MR image obtained before injection of labeled cells shows absence of low signal intensity around lesion (asterisk) in left temporal lobe. B, MR image obtained 1 day after implantation of stem cells shows circular areas of low signal intensity at injection sites. Asterisk indicates lesion. C, Magnified MR image obtained 1 day after injection shows four areas of low signal intensity (arrows) at injection sites around lesion (asterisk). D, Magnified MR image obtained 7 days after injection shows area of low signal intensity (white arrow) posterior to lesion, indicating presence of ferumoxides-labeled neural stem cells. Asterisk indicates lesion; black arrows, injection sites. E, Magnified MR image obtained 14 days after injection shows fading of low signal intensity at injection sites (black arrows) and emergence of new area of low signal intensity (arrowhead) that spreads along border of injured brain tissue (asterisk). White arrow indicates area of low signal intensity that emerged on day 7. F, Magnified MR image obtained 21 days after injection shows areas of low signal intensity have expanded and extend farther along lesion (white arrow). Asterisk indicates lesion; black arrows, injection sites; arrowhead, area of low signal intensity that emerged on day 14. G, MR image shows findings before injection of unlabeled neural stem cells. H, MR image shows findings 1 day after injection. I–L, Magnified MR images obtained 1 (I), 7 (J), 14 (K), and 21 (L) days after injection show slightly hypointense areas around injection sites (arrows). Asterisk indicates lesion.
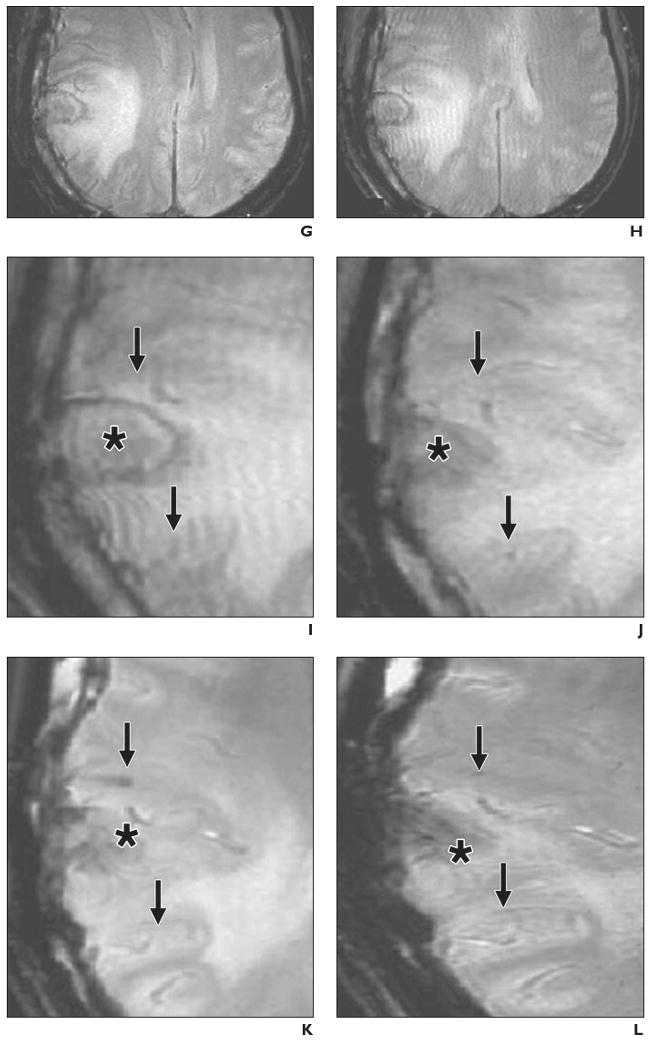
34-year-old man with traumatic brain injury (A–F) who received stereotactic injection of ferumoxides-labeled neural stem cells and 42-year-old man with traumatic brain injury (G–L) who received unlabeled autologous neural stem cells. MRI performed at 3 T. (Reprinted with permission from [26]) A, MR image obtained before injection of labeled cells shows absence of low signal intensity around lesion (asterisk) in left temporal lobe. B, MR image obtained 1 day after implantation of stem cells shows circular areas of low signal intensity at injection sites. Asterisk indicates lesion. C, Magnified MR image obtained 1 day after injection shows four areas of low signal intensity (arrows) at injection sites around lesion (asterisk). D, Magnified MR image obtained 7 days after injection shows area of low signal intensity (white arrow) posterior to lesion, indicating presence of ferumoxides-labeled neural stem cells. Asterisk indicates lesion; black arrows, injection sites. E, Magnified MR image obtained 14 days after injection shows fading of low signal intensity at injection sites (black arrows) and emergence of new area of low signal intensity (arrowhead) that spreads along border of injured brain tissue (asterisk). White arrow indicates area of low signal intensity that emerged on day 7. F, Magnified MR image obtained 21 days after injection shows areas of low signal intensity have expanded and extend farther along lesion (white arrow). Asterisk indicates lesion; black arrows, injection sites; arrowhead, area of low signal intensity that emerged on day 14. G, MR image shows findings before injection of unlabeled neural stem cells. H, MR image shows findings 1 day after injection. I–L, Magnified MR images obtained 1 (I), 7 (J), 14 (K), and 21 (L) days after injection show slightly hypointense areas around injection sites (arrows). Asterisk indicates lesion.
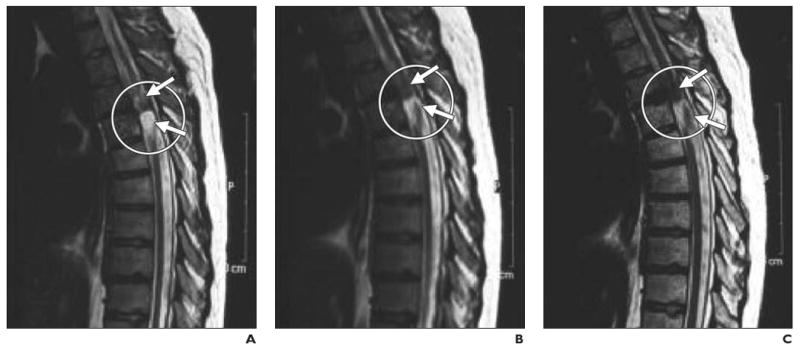
21-year-old man with chronic spinal cord injury. (Reprinted with permission from [27]) A–C, Serial MR images obtained before (A) and 20 (B) and 35 (C) days after injection of dynamagnetic bead–labeled CD34+ bone marrow stem cells show site of injury at T4–T5 level (circle). Hypointense areas (arrows) near site of injury expanded at later time points, presumably as result of targeted migration of bone marrow stem cells.
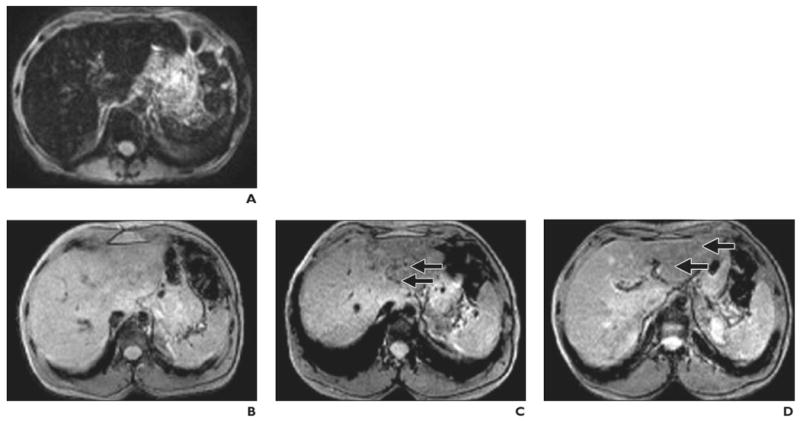
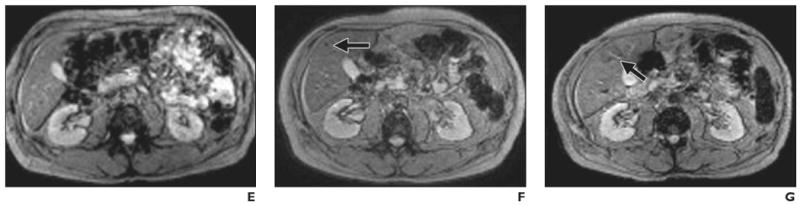
Findings before and after intraportal transplantation of ferucarbotran-labeled human cadaveric islet cells. (Reprinted with permission from [28]) A, 56-year-old woman with type 1 diabetes. MR image obtained before transplantation shows spontaneous iron overload, which is common in patients with type 1 diabetes and prevents visualization of hypointense islet cells. B–D, 42-year-old man with type 1 diabetes. MR images show appearance before (B) and 5 days (C) and 6 weeks (D) after transplantation. Arrows indicate areas of low signal intensity induced by engrafted islets. Hepatic signal intensity is normal. E–G, 62-year-old man with type 1 diabetes. MR images show appearance before (E) and 5 days (F) and 6 months (G) after transplantation. Arrows indicate areas of low signal intensity induced by engrafted islets. Hepatic signal intensity is normal.
Findings before and after intraportal transplantation of ferucarbotran-labeled human cadaveric islet cells. (Reprinted with permission from [28]) A, 56-year-old woman with type 1 diabetes. MR image obtained before transplantation shows spontaneous iron overload, which is common in patients with type 1 diabetes and prevents visualization of hypointense islet cells. B–D, 42-year-old man with type 1 diabetes. MR images show appearance before (B) and 5 days (C) and 6 weeks (D) after transplantation. Arrows indicate areas of low signal intensity induced by engrafted islets. Hepatic signal intensity is normal. E–G, 62-year-old man with type 1 diabetes. MR images show appearance before (E) and 5 days (F) and 6 months (G) after transplantation. Arrows indicate areas of low signal intensity induced by engrafted islets. Hepatic signal intensity is normal.
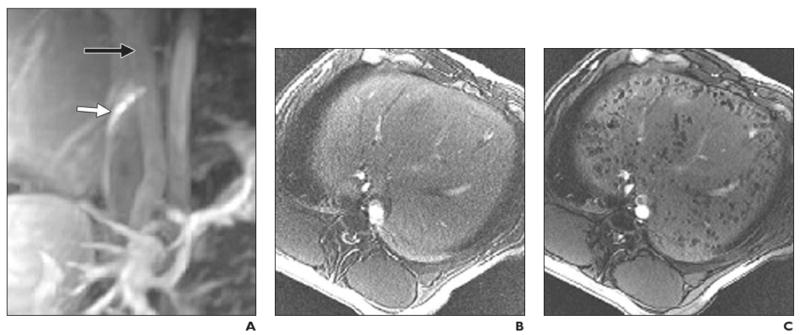
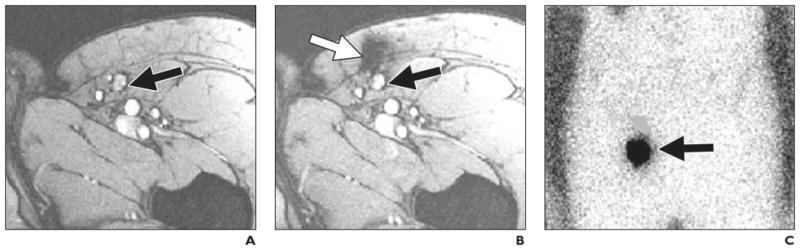
Intraportal injection of cellular therapeutic agent into healthy pig. MRI-guided transplantation of cadaveric human pancreatic islets encapsulated into ferumoxides-labeled semipermeable alginate capsules, or magnetocapsules. (Reprinted with permission from [38]) A, Conventional MR angiogram–venogram of mesenteric venous system obtained with 30 mL saline solution containing 0.1 mM gadopentetate dimeglumine before intraportal injection. Needle (white arrow) is in inferior vena cava with proper orientation for portacaval puncture. Black arrow indicates portal vein. B and C, In vivo MR images obtained before (B) and 5 minutes after (C) intraportal infusion of magnetocapsules shows capsules as hypointense voids throughout liver.
References
-
- Gilad AA, McMahon MT, Walczak P, et al. Artificial reporter gene providing MRI contrast based on proton exchange. Nat Biotechnol. 2007;25:217–219. - PubMed
-
- Cowper SE. Nephrogenic systemic fibrosis: a review and exploration of the role of gadolinium. Adv Dermatol. 2007;23:131–154. - PubMed
-
- Morcos SK, Thomsen HS. Nephrogenic systemic fibrosis: more questions and some answers. Nephron Clin Pract. 2008;110:c24–c31. - PubMed
-
- Abraham JL, Thakral C. Tissue distribution and kinetics of gadolinium and nephrogenic systemic fibrosis. Eur J Radiol. 2008;66:200–207. - PubMed
Publication types
MeSH terms
Substances
Grants and funding
LinkOut - more resources
Full Text Sources
Other Literature Sources
