. 2009 Aug 4;106(31):13040-5.
doi: 10.1073/pnas.0905267106. Epub 2009 Jul 20.

Correspondence of the brain's functional architecture during activation and rest

Affiliations

Correspondence of the brain's functional architecture during activation and rest

Stephen M Smith et al. Proc Natl Acad Sci U S A. .

Abstract

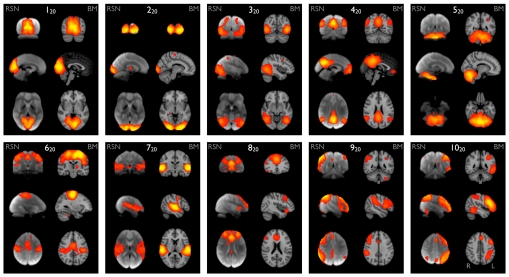
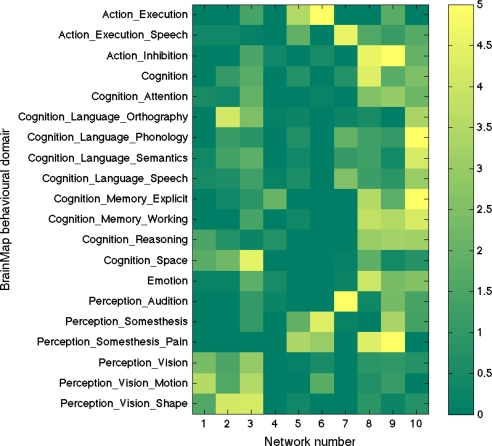
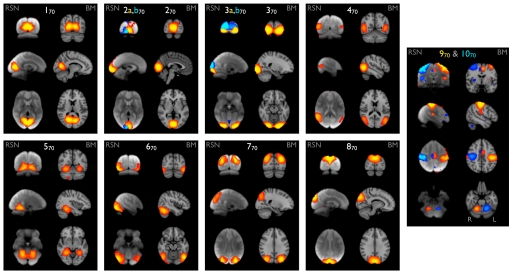
Neural connections, providing the substrate for functional networks, exist whether or not they are functionally active at any given moment. However, it is not known to what extent brain regions are continuously interacting when the brain is "at rest." In this work, we identify the major explicit activation networks by carrying out an image-based activation network analysis of thousands of separate activation maps derived from the BrainMap database of functional imaging studies, involving nearly 30,000 human subjects. Independently, we extract the major covarying networks in the resting brain, as imaged with functional magnetic resonance imaging in 36 subjects at rest. The sets of major brain networks, and their decompositions into subnetworks, show close correspondence between the independent analyses of resting and activation brain dynamics. We conclude that the full repertoire of functional networks utilized by the brain in action is continuously and dynamically "active" even when at "rest."


Conflict of interest statement

The authors declare no conflict of interest.

Figures

Fig. 1.
Fig. 1.
Ten well-matched pairs of networks from the 20-component analysis of the 29,671-subject BrainMap activation database and (a completely separate analysis of) the 36-subject resting FMRI dataset. This figure shows the 3 most informative orthogonal slices for each pair. (Left column of each pair) Resting FMRI data, shown superimposed on the mean FMRI image from all subjects. (Right column of each pair) Corresponding network from BrainMap, shown superimposed on the MNI152 standard space template image. The networks were paired automatically by using spatial cross-correlation, with mean r = 0.53 (0.25:0.79); the weakest of these correlations thus has a significance of P < 10−5 (corrected). All ICA spatial maps were converted to z statistic images via a normalized mixture–model fit, and then thresholded at Z = 3.
Fig. 2.
Fig. 2.
A mapping of the 10 primary functional networks shown in Fig. 1 onto the “behavioral domains” (experimental paradigm classifications) in the BrainMap database. Each of the BrainMap-derived ICA spatial maps has an associated experiment-ID “time course” quantifying its relevance to each of the original 7,342 BrainMap activation images. Each one of those activation images is listed, in BrainMap, against 1 or more of 66 possible “behavioral domains.” By multiplying the value at each time point by the corresponding behavioral domain(s) and averaging over all time points (experiments), we can derive a measure of how strongly each network relates to each behavioral domain, subject to interpretational caveats regarding such “reverse inference” (24) (see SI for detail; color scale is arbitrary units). Each row is normalized to have a mean count of 1, to balance for different domains being represented different numbers of times in the database. Of the original 66 behavioral domains, we show here only those that correspond most strongly to the 10 maps, for display brevity.
Fig. 3.
Fig. 3.
Eight well-matched pairs of networks in visual areas (1–870), and 2 pairs from the sensorimotor areas (9, 1070), from the 70-component analyses of the BrainMap activation database and the resting FMRI dataset. All Gaussianized ICA maps are thresholded at Z = 4 (higher than for the 20-dimensional results for comparability, because the higher-dimensional analysis, by definition, has reduced ICA residuals).

Similar articles

Cited by

References

    1. Biswal B, Zerrin Yetkin F, Haughton V, Hyde J. Functional connectivity in the motor cortex of resting human brain using echo-planar MRI. Magn Reson Med. 1995;34:537–541. - PubMed
    1. Xiong J, Parsons L, Gao J, Fox P. Interregional connectivity to primary motor cortex revealed using MRI resting state images. Hum Brain Mapp. 1999;8:151–156. - PMC - PubMed
    1. Cordes D, et al. Mapping functionally related regions of brain with functional connectivity MR imaging. Am J Neuroradiol. 2000;21:1636–1644. - PMC - PubMed
    1. Beckmann CF, De Luca M, Devlin JT, Smith SM. Investigations into resting-state connectivity using independent component analysis. Philos Trans R Soc London. 2005;360(1457):1001–1013. - PMC - PubMed
    1. Fukunaga M, et al. Large-amplitude, spatially correlated fluctuations in BOLD fMRI signals during extended rest and early sleep stages. Magn Reson Imaging. 2006;24:979–992. - PubMed

Publication types

LinkOut - more resources