. 2009 Aug;119(8):2231-44.
doi: 10.1172/JCI37716. Epub 2009 Jul 13.

Polyethylenimine-based siRNA nanocomplexes reprogram tumor-associated dendritic cells via TLR5 to elicit therapeutic antitumor immunity

Affiliations

Polyethylenimine-based siRNA nanocomplexes reprogram tumor-associated dendritic cells via TLR5 to elicit therapeutic antitumor immunity

Juan R Cubillos-Ruiz et al. J Clin Invest. 2009 Aug.

Abstract

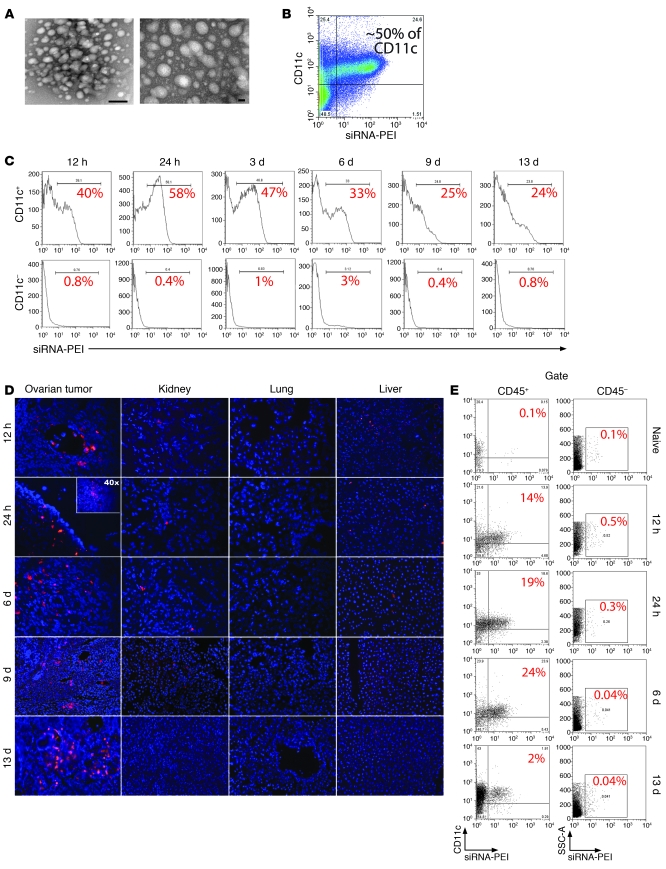
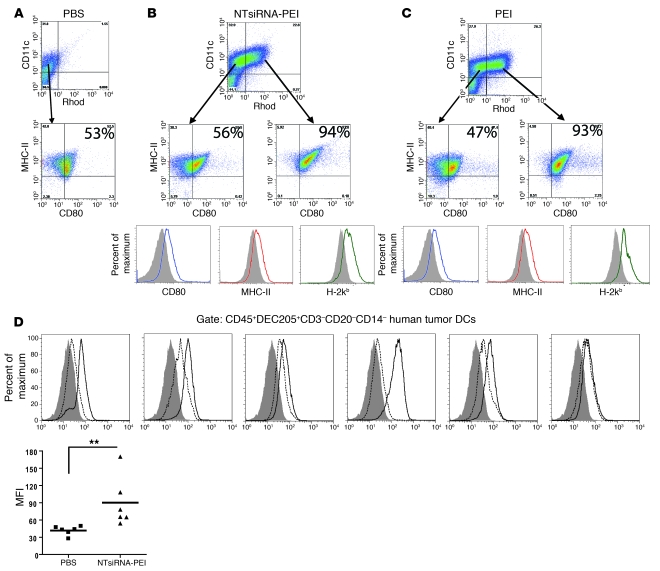
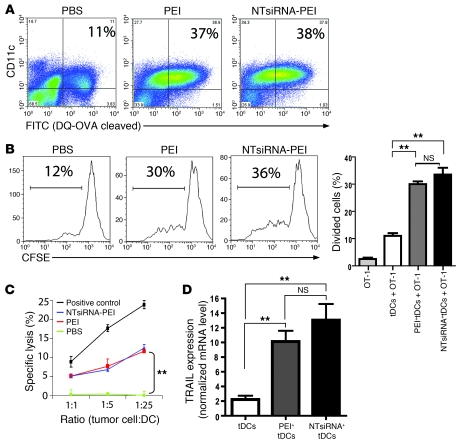
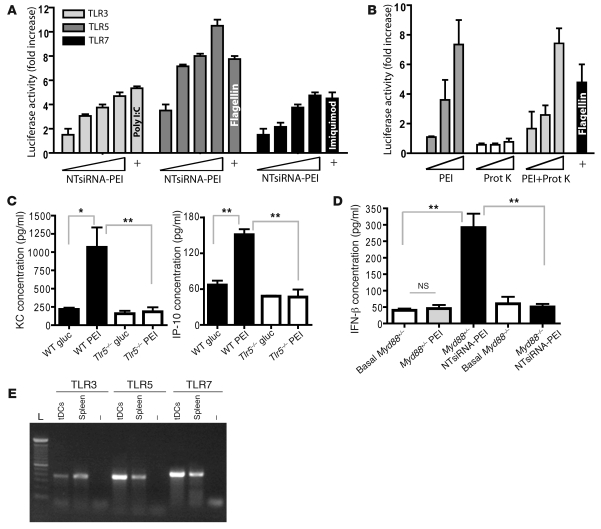
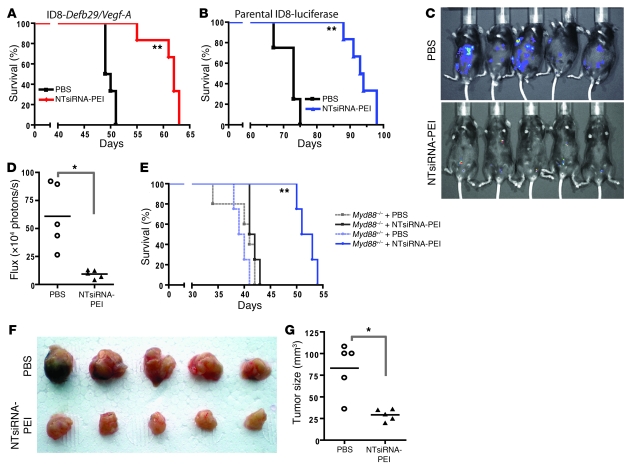
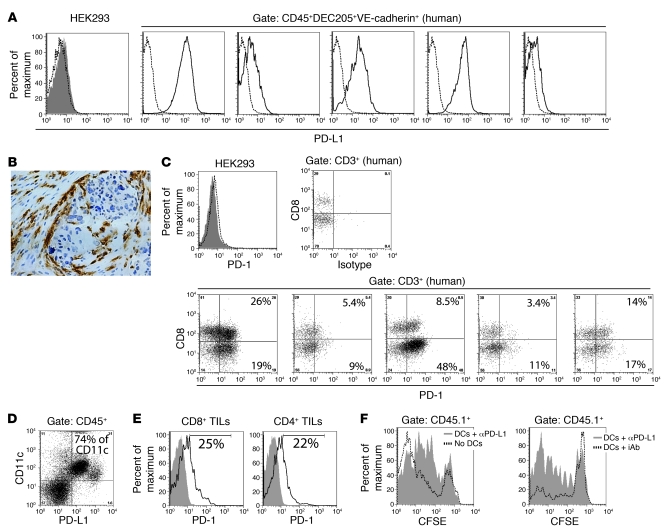
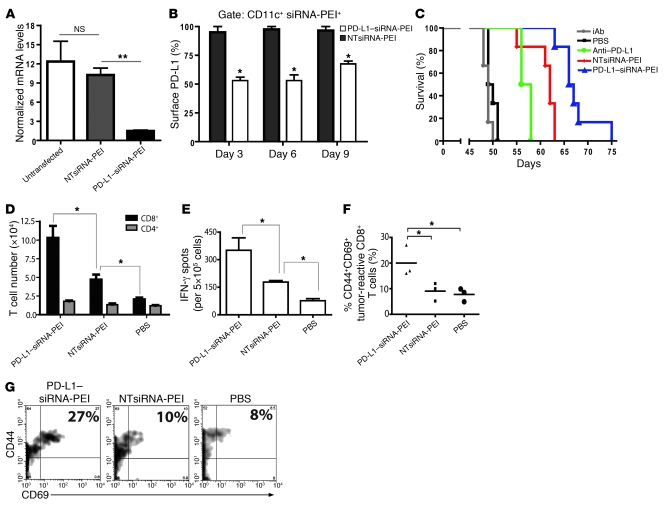
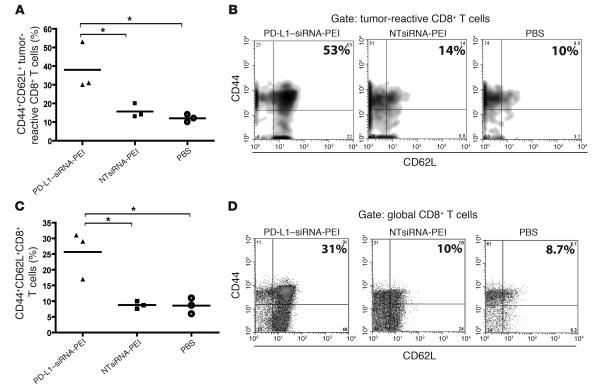
The success of clinically relevant immunotherapies requires reversing tumor-induced immunosuppression. Here we demonstrated that linear polyethylenimine-based (PEI-based) nanoparticles encapsulating siRNA were preferentially and avidly engulfed by regulatory DCs expressing CD11c and programmed cell death 1-ligand 1 (PD-L1) at ovarian cancer locations in mice. PEI-siRNA uptake transformed these DCs from immunosuppressive cells to efficient antigen-presenting cells that activated tumor-reactive lymphocytes and exerted direct tumoricidal activity, both in vivo and in situ. PEI triggered robust and selective TLR5 activation in vitro and elicited the production of hallmark TLR5-inducible cytokines in WT mice, but not in Tlr5-/- littermates. Thus, PEI is a TLR5 agonist that, to our knowledge, was not previously recognized. In addition, PEI-complexed nontargeting siRNA oligonucleotides stimulated TLR3 and TLR7. The nonspecific activation of multiple TLRs (specifically, TLR5 and TLR7) reversed the tolerogenic phenotype of human and mouse ovarian tumor-associated DCs. In ovarian carcinoma-bearing mice, this induced T cell-mediated tumor regression and prolonged survival in a manner dependent upon myeloid differentiation primary response gene 88 (MyD88; i.e., independent of TLR3). Furthermore, gene-specific siRNA-PEI nanocomplexes that silenced immunosuppressive molecules on mouse tumor-associated DCs elicited discernibly superior antitumor immunity and enhanced therapeutic effects compared with nontargeting siRNA-PEI nanocomplexes. Our results demonstrate that the intrinsic TLR5 and TLR7 stimulation of siRNA-PEI nanoparticles synergizes with the gene-specific silencing activity of siRNA to transform tumor-infiltrating regulatory DCs into DCs capable of promoting therapeutic antitumor immunity.


Figures

Figure 1
Figure 1. siRNA-PEI nanoparticles are preferentially engulfed by tumor-associated DCs.
(A) NTsiRNA-PEI were stained with uranyl acetate and visualized using transmission electron microscopy. Original magnification, ×145,000 (left); ×285,000 (right). Scale bars: 20 nm (left); 100 nm (right). Average nanoparticle size was 40–60 nm. (B) Selective engulfment of NTsiRNA-PEI by peritoneal tumor-associated CD11c+ DCs. Rhodamine-labeled NTsiRNA-PEI were intraperitoneally injected into mice bearing ID8-Defb29/Vegf-A ovarian carcinoma, and peritoneal wash samples were analyzed by FACS after 3 days. (C) Time-course analysis of nanocomplex uptake by peritoneal CD11c+ DCs in tumor-bearing mice after a single intraperitoneal injection. The percentage of cells retaining the nanoparticles is indicated for each time point. Data are representative of 3 mice analyzed per time point in 2 independent experiments. (D) Biodistribution of intraperitoneally injected siRNA-PEI nanoparticles. Ovarian carcinoma–bearing mice received a single intraperitoneal injection of rhodamine-labeled NTsiRNA-PEI, and multiple organs were collected at different time points after injection. Fluorescence microscopy was performed on histological sections from different organs to determine the presence of nanoparticles. Red indicates rhodamine-labeled nanocomplexes. Blue denotes nuclei. Data are representative of at least 3 independent experiments. Original magnification, ×200; ×40 (inset). (E) Nanoparticle uptake by DCs infiltrating solid ovarian tumors. Ovaries from tumor-bearing mice were collected at different time points after a single intraperitoneal injection with rhodamine-labeled NTsiRNA-PEI. Shown is the percentage of ovarian tumor–resident DCs engulfing nanoparticles in situ, determined by FACS. Data are representative of 2 independent experiments. SSC-A, side-scattered light.
Figure 2
Figure 2. Engulfment of PEI-based nanocomplexes induces maturation of tumor-associated DCs in vivo and in situ.
(A) Expression of CD80 and MHC-II on tumor-associated DCs from mice bearing ID8-Defb29/Vegf-A tumors for 3 weeks and injected with PBS. (B) Rhodamine-labeled NTsiRNA-PEI or (C) equivalent amounts of rhodamine-labeled PEI alone (see Methods) were intraperitoneally injected into mice bearing ID8-Defb29/Vegf-A tumors for 3 weeks. Expression of CD80, MHC-I, and MHC-II on tumor DCs that engulfed the nanoparticles or PEI was analyzed by FACS 3 days later. Rhod, rhodamine-labeled PEI. Filled histograms represent expression on DCs that did not engulf nanoparticles or PEI. Open histograms indicate expression by DCs that engulfed nanoparticles or PEI in the same host. Data are representative of 3 mice per group in 4 independent experiments. In AC, the percentage of tumor-associated DCs coexpressing MHC-II and CD80 is indicated. (D) siRNA-PEI nanoparticles induced maturation of human tumor DCs. Leukocytes from 6 unselected dissociated stage III human ovarian tumors were enriched by Ficoll, 5 × 10⁶ cells were incubated in 5 ml RPMI containing 100 μl PBS (dotted histograms) or 100 μl NTsiRNA-PEI (open histograms; see Methods), and the levels of CD80 on CD45+DEC205+CD3CD20CD14 tumor DCs were analyzed by FACS 18 hours later. Filled histograms represent staining with isotype control antibodies. MFI, mean fluorescence intensity of CD80 staining. Data points and horizontal bars denote individual values and means, respectively. **P < 0.01 (Mann-Whitney).
Figure 3
Figure 3. siRNA-PEI nanoparticles enhance antigen presentation and induce tumoricidal activity by ovarian cancer DCs.
(A) Improved antigen-processing capacity of tumor DCs engulfing PEI-based nanocomplexes in vivo. Mice bearing ID8-Defb29/Vegf-A tumors were intraperitoneally injected with DQ-OVA (see Methods), and 24 hours later received a single intraperitoneal injection of PBS, PEI, or NTsiRNA-PEI (3 mice per group, 2 independent experiments). Percentages denote the proportion of peritoneal tumor-associated DCs that efficiently processed the probe (FITC+), determined by FACS 48 hours later. (B) Enhanced antigen-presenting ability of OVA-pulsed tumor DCs (tDCs) engulfing siRNA-PEI nanoparticles in vivo (see Methods). Shown are representative FACS analysis of CFSE dilution and graphical representation of percent proliferating cells in triplicate for each condition. (C) Uptake of siRNA-PEI nanocomplexes induced tumoricidal DCs. Tumor-bearing mice were intraperitoneally injected with PBS, PEI, or NTsiRNA-PEI; 36 hours later, CD11c+MHC-II+CD3NK1.1 tumor DCs from each group were sorted and incubated with 51Cr-labeled ID8-Defb29/Vegf-A cells. Release of 51Cr was measured in cell supernatants 5 hours later. Radiolabeled tumor cells were also cocultured with C57BL/6 splenocytes preincubated with 1,000 U/ml IL-2 for 5 days as a positive control of lysis. (D) Quantification of TRAIL mRNA levels by real-time RT-PCR in the same tumor DCs as in C. Error bars in BD denote SEM. **P < 0.01.
Figure 4
Figure 4. siRNA-PEI nanoparticles stimulate multiple TLRs in vitro and in vivo.
(A) siRNA-PEI nanocomplexes dose-dependently stimulated TLR3, TLR5, and TLR7 in vitro. Cotransfected HEK293 cells were stimulated with increasing amounts of siRNA-PEI nanoparticles or positive control agonists (+) as described in Methods. Data are representative of 4 independent experiments. (B) PEI was sufficient to stimulate TLR5 in vitro in a dose-dependent manner. HEK293 cells expressing TLR5 and harboring an NF-κB–dependent luciferase reporter plasmid were stimulated with increasing amounts of PEI, proteinase K (Prot K), or PEI treated overnight at 55°C with proteinase K (1 mg/ml), and luciferase activity was measured as described in Methods. Data are representative of 3 independent experiments. (C) PEI induced rapid cytokine secretion in vivo in a TLR5-dependent manner. Naive WT or Tlr5–/– mice were intraperitoneally injected with 5% glucose (gluc) or linear PEI, and serum levels of KC and IP-10 were determined 2 hours later by cytokine assay (see Methods). Data are representative of 4 mice per group, 2 independent experiments. (D) PEI-complexed siRNA induced MyD88-dependent secretion of IFN-β at tumor locations. Ascites from Myd88+/– or Myd88–/– mice bearing advanced ID8-Defb29/Vegf-A ovarian tumors were collected prior to (Basal) and 3 hours after intraperitoneal administration of PEI or NTsiRNA-PEI, and levels of IFN-β were analyzed by ELISA. Data are representative of 4 mice per group, 2 independent experiments. (E) CD45+CD11c+MHC-II+ tumor DCs were sorted from the peritoneal cavity of mice bearing ID8-Defb29/Vegf-A tumors, and TLR expression was confirmed by RT-PCR. Error bars in AD denote SEM. *P < 0.05; **P < 0.01.
Figure 5
Figure 5. siRNA-PEI nanocomplexes prolong survival in a T cell–mediated, MyD88-dependent manner.
(A and B) Mice bearing aggressive ID8-Defb29/Vegf-A (A) or luciferase-expressing parental ID8 (B) tumors were treated intraperitoneally with PBS or NTsiRNA-PEI nanoparticles at days 8, 13, 18, 23, and 27 after tumor challenge, and survival was monitored over time. Data are representative of 2 independent experiments with a total of 12 mice per group. (C) Mice bearing preestablished luciferase-expressing parental ID8 ovarian tumors were intraperitoneally treated with PBS or NTsiRNA-PEI as described above, and luciferin was injected 70 days after tumor challenge to monitor tumor burden in vivo. (D) Quantification of the tumor burden shown in C. (E) Nanoparticle-mediated increase in survival was completely MyD88 dependent. Myd88+/– or Myd88–/– mice bearing aggressive ID8-Defb29/Vegf-A ovarian tumors were treated with PBS or NTsiRNA-PEI as described above, and survival was monitored over time. Data are representative of 2 independent experiments with a total of 10 mice per group. (F) Treatment with siRNA-PEI nanocomplexes induced T cell–mediated antitumor protective immunity. CD3+ T cells (3 × 10⁶) purified from the spleens of mice treated with PBS or NTsiRNA-PEI were intravenously transferred into naive C57BL/6 mice previously irradiated with 3 Gy (n = 5 per group); after 24 hours, mice were challenged in the flank with ID8-Defb29/Vegf-A ovarian carcinoma cells. Tumor pictures were taken 2 months later. (G) Quantification of tumor size from F. In D and G, data points and horizontal bars denote individual values and means, respectively. *P < 0.05; **P < 0.01 versus respective PBS control, log-rank test (A, B, and E) or Mann-Whitney test (D and G).
Figure 6
Figure 6. PD-L1 on ovarian cancer–associated DCs inhibits antigen-specific T cell responses.
(A) FACS analysis of PD-L1 expression on HEK293 cells (negative control) or CD45+DEC205+VE-cadherin+ DCs infiltrating 5 unselected dissociated stage III human tumors. Dotted histograms represent isotype control staining. (B) Representative immunohistochemistry of PD-L1+ cells surrounding a tumor islet in a human ovarian carcinoma specimen. Original magnification, ×200. (C) PD-1 expression on control HEK293 cells and tumor-infiltrating lymphocytes (TILs) matching the human specimens in A. Dotted histogram represents isotype control staining; filled histogram demonstrates negative PD-1 staining. The percentage of human tumor-infiltrating T cells that express PD-1 is indicated. (D) PD-L1 expression by peritoneal tumor DCs in mice bearing advanced ID8-Defb29/Vegf-A ovarian carcinoma. The percentage of CD11c+ cells coexpressing PD-L1 is indicated. (E) Representative FACS analysis of PD-1 expression by T cells infiltrating mouse ID8-Defb29/Vegf-A ovarian tumors. Filled histograms indicate isotype control; open histograms show PD-1 staining. The percentage of mouse tumor-infiltrating T cells expressing PD-1 is indicated. (F) Representative FACS analyses of mice transferred with PD-L1–blocked DCs compared with both a mouse that did not receive DCs (left) and a mouse transferred with DCs incubated with corresponding isotype control antibodies (iAb; right).
Figure 7
Figure 7. Treatment with PD-L1–siRNA-PEI induces enhanced therapeutic effects.
(A) Ascites cells from mice bearing ID8-Defb29/Vegf-A tumors were left untreated or transfected in vitro with PD-L1–siRNA-PEI or NTsiRNA-PEI, and PD-L1 mRNA levels were measured 48 hours later by real-time RT-PCR. Experiments were repeated 3 times with similar results. (B) Silencing PD-L1 on tumor DCs in vivo. Tumor-bearing mice were intraperitoneally injected with rhodamine-labeled PD-L1–siRNA-PEI or NTsiRNA-PEI, and PD-L1 expression in tumor DCs that engulfed the nanocomplexes was determined by FACS. Experiments were repeated twice with similar results. (C) Mice bearing aggressive ID8-Defb29/Vegf-A tumors were treated intraperitoneally as described in Methods, and survival was monitored over time. Data are representative of 2 independent experiments, 12 mice per group. Significant differences were as follows: anti–PD-L1 versus isotype control antibodies (P < 0.05), NTsiRNA-PEI versus PBS (P < 0.01), PD-L1–siRNA-PEI versus anti–PD-L1 (P < 0.05), and PD-L1–siRNA-PEI versus NTsiRNA-PEI (P < 0.05). (DG) Improved antitumor immune responses at tumor locations in mice treated with PD-L1–siRNA-PEI. Tumor-bearing mice (n = 3 per group, 3 independent experiments) were treated as described above, and peritoneal wash samples were analyzed at day 27. (D) CD4+ and CD8+ T cell infiltration in the peritoneal cavities of treated mice. (E) Representative ELISPOT analysis showing increased numbers of IFN-γ–producing cells in mice treated with PD-L1–siRNA-PEI. (F) Proportion of activated tumor-specific CD8+ T cells infiltrating the peritoneal cavities of mice. Data points and horizontal bars denote individual values and means, respectively. (G) Representative FACS analysis of F. The percentage of tumor-reactive CD8+ T cells coexpressing the activation markers CD44 and CD69 is indicated. Error bars in A, B, D, and E denote SEM. *P < 0.05; **P < 0.01.
Figure 8
Figure 8. Increased proportion of antitumor central memory–like T cells in the bone marrow of mice treated with PD-L1–siRNA-PEI.
(A) Percentage of tumor-reactive CD8+ T cells expressing central memory markers in the bone marrow of mice treated with PD-L1–siRNA-PEI. (B) Representative FACS analysis of A. (C) Proportion of global CD8+ T cells exhibiting a central memory–like phenotype in the bone marrow of tumor-bearing mice. Data are representative of 3 independent experiments with similar results. (D) Representative FACS analysis of C. *P < 0.05. In B and D, the percentage of tumor-reactive or global CD8+ T cells coexpressing the central memory markers CD44 and CD62L is indicated.

References

    1. Jemal A., et al. Cancer statistics, 2008. CA Cancer J. Clin. 2008;58:71–96. doi: 10.3322/CA.2007.0010. - DOI - PubMed
    1. Coukos G., Conejo-Garcia J.R., Buckanovich R., Benencia F. Vascular leukocytes: a population with angiogenic and immunossuppressive properties highly represented in ovarian cancer. Adv. Exp. Med. Biol. 2007;590:185–193. doi: 10.1007/978-0-387-34814-8_13. - DOI - PubMed
    1. Curiel T.J., et al. Blockade of B7-H1 improves myeloid dendritic cell-mediated antitumor immunity. Nat. Med. 2003;9:562–567. doi: 10.1038/nm863. - DOI - PubMed
    1. Gabrilovich D.I., et al. 2007The terminology issue for myeloid-derived suppressor cells. Cancer Res. 67425 ; author reply 426 . - PMC - PubMed
    1. Plate J.M., Harris J.E. Immune cell functions in pancreatic cancer. Crit. Rev. Immunol. 2000;20:375–392. - PubMed

Publication types

MeSH terms