. 2009 Aug;119(8):2291-303.
doi: 10.1172/JCI37209. Epub 2009 Jul 20.

Prolylcarboxypeptidase regulates food intake by inactivating alpha-MSH in rodents

Affiliations

Prolylcarboxypeptidase regulates food intake by inactivating alpha-MSH in rodents

Nicholas Wallingford et al. J Clin Invest. 2009 Aug.

Abstract

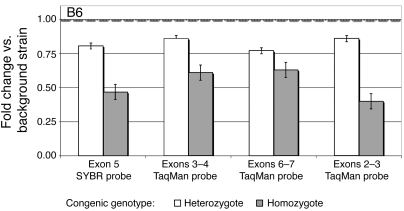
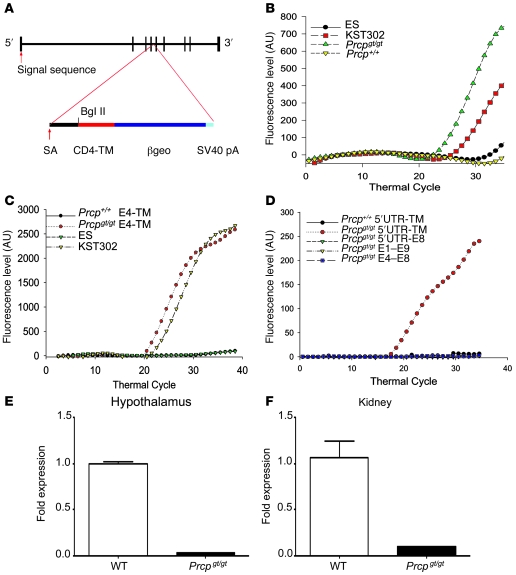
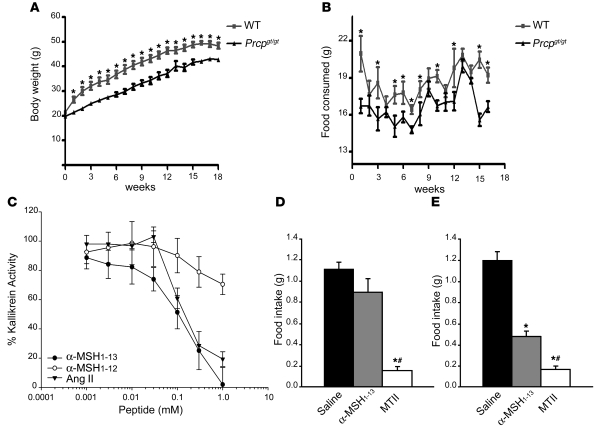
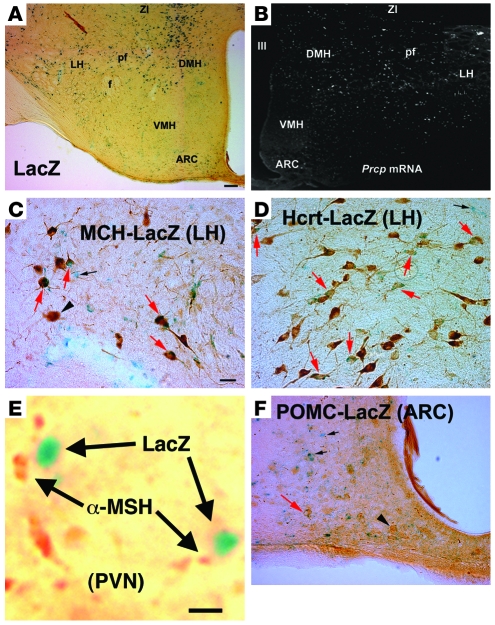
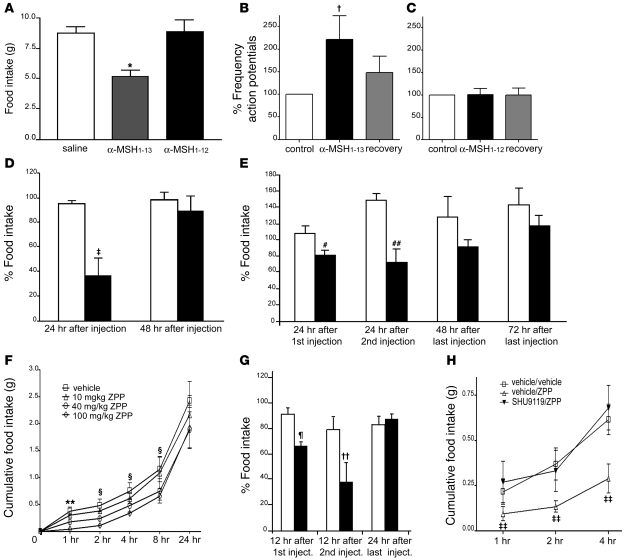
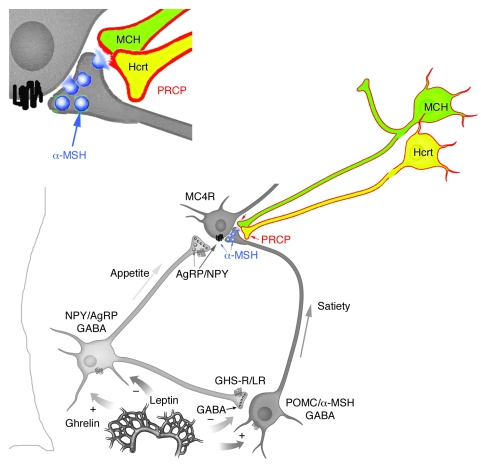
The anorexigenic neuromodulator alpha-melanocyte-stimulating hormone (alpha-MSH; referred to here as alpha-MSH1-13) undergoes extensive posttranslational processing, and its in vivo activity is short lived due to rapid inactivation. The enzymatic control of alpha-MSH1-13 maturation and inactivation is incompletely understood. Here we have provided insight into alpha-MSH1-13 inactivation through the generation and analysis of a subcongenic mouse strain with reduced body fat compared with controls. Using positional cloning, we identified a maximum of 6 coding genes, including that encoding prolylcarboxypeptidase (PRCP), in the donor region. Real-time PCR revealed a marked genotype effect on Prcp mRNA expression in brain tissue. Biochemical studies using recombinant PRCP demonstrated that PRCP removes the C-terminal amino acid of alpha-MSH1-13, producing alpha-MSH1-12, which is not neuroactive. We found that Prcp was expressed in the hypothalamus in neuronal populations that send efferents to areas where alpha-MSH1-13 is released from axon terminals. The inhibition of PRCP activity by small molecule protease inhibitors administered peripherally or centrally decreased food intake in both wild-type and obese mice. Furthermore, Prcp-null mice had elevated levels of alpha-MSH1-13 in the hypothalamus and were leaner and shorter than the wild-type controls on a regular chow diet; they were also resistant to high-fat diet-induced obesity. Our results suggest that PRCP is an important component of melanocortin signaling and weight maintenance via control of active alpha-MSH1-13 levels.


Figures

Figure 1
Figure 1. RT-PCR for quantitation of Prcp in brain.
PRCP real-time PCR in brain of B6.C-D7Mit353 congenic mice using probes targeting exons 5, 3–4, 6–7, and 2–3. The results for heterozygous and homozygous congenic mice are expressed as fold changes relative to the background strain (represented by a value of 1.00). Data represent the mean ± SEM. Ct means and SDs are available in Supplemental Table 5.
Figure 2
Figure 2. Generation and characterization of Prcpgt/gt mice.
(A) The gene trap method of generating Prcpgt/gt mice involved a βgeo targeting vector randomly incorporating into intron 4. The CD4-TM-βgeo incorporated into genes with a signal sequence allowed for LacZ expression and interruption of PRCP expression. These interruptions were screened with X-gal staining. SV40 pA, SV40 polyadenylation signal. (B) Real-time PCR analysis was performed to screen for LacZ expression in Prcpgt/gt and Prcp+/+ mice, in wild-type cells (ES), or in a PRCP gene–trapped PRCP cell line (KST302). Shown are representative real-time PCR results for 1 mouse and 1 cell DNA sample (n = 5 mice). (C) Real-time PCR from kidney of Prcpgt/gt or Prcp+/+ mice or ES or KST302 cells around the insertional mutation site using sense primers to exon 4 of PRCP and antisense primers to the TM region of pGT1TM vector and a probe common to the contiguous sequence of exon 4 with the splicing acceptor (SA) region of pGT1TM vector. The figure shows representative results for the wild-type (n = 5) and Prcpgt/gt mice (n = 5) included in the experiment shown in B. (D) Real-time PCR from kidneys of Prcpgt/gt or Prcp+/+ mice using a probe that spans the 3ι region of exon 4 and splice acceptor region of the vector of the cDNA using various combinations of sense and antisense primers of Prcp. The figure is a representative experiment on a single mRNA specimen (20 experiments performed in total). (E and F) Graphs showing the results of real-time PCR for Prcp in hypothalamic and kidney samples from Prcpgt/gt mice and wild-type controls. Data represent the mean ± SEM.
Figure 3
Figure 3. α-MSH is a substrate of PRCP.
(A and B) Changes in body weight and food intake of Prcpgt/gt mice and wild-type controls exposed to HFD. Data represent the mean ± SEM. (C) Increasing concentrations of α-MSH1–13, α-MSH1–12, or Ang II (0.001–1 mM) were incubated with 8 nM of rPRCP51 at 37°C in microtiter plate cuvette wells with preabsorbed HK and containing 20 nM PK. The liberation of paranitroanilide (pNA) from the S2302 by the formed plasma kallikrein in the presence of the peptide was measured at 405 nm. Results are expressed as residual formed plasma kallikrein activity. The data represent the mean ± SEM of 3 independent measurements. (D and E) Food intake in grams 4 hours after an i.p. injection of 200 nmol of α-MSH1–13 or 200 nmol of MTII in wild-type (D) or Prcpgt/gt mice (E) compared with saline-injected control animals. Data represent the mean ± SEM. *P < 0.001 compared with saline; #P < 0.001 compared with α-MSH.
Figure 4
Figure 4. α-MSH levels in Prcpgt/gt mice.
(A and B) Mass spectrometry analysis of products of the in vitro PRCP reaction with α-MSH1–13. (A) Control (T0) analysis. (B) Liquid chromatography–mass spectrometry (LC-MS) analysis for the 1-hour incubation reaction (T1). The HPLC chromatogram base peaks are shown in the top panels for the retention time (RT) ranging from 25 to 40 minutes. A major peak eluting at 32 minutes (A, top panel, gray) has an MS spectrum perfectly matching the triply charged ion isotopic masses (middle panel) and α-MSH1–13 theoretical size (MW, 1,665 Da). A new peak eluting at 30 minutes (B, top panel, gray) appears in the 1-hour reaction. Its MS spectrum matches the triply charged ion isotopic masses of α-MSH1–12 standard (B, bottom panel) and its theoretical size (MW, 1,566 daltons). α-MSH1–12 was not detected in the control samples (A, bottom panel). Standard spectra are shown overlaid in gray inserts. (C) α-MSH levels (expressed as fmol α-MSH/mg protein) in the hypothalamus of Prcpgt/gt mice (n = 29) compared with wild-type controls (n = 14). Data represent the mean ± SEM. *P = 0.046. (D) α-MSH/ACTH ratio in the hypothalamus of Prcpgt/gt mice compared with wild-type controls. Data represent the mean ± SEM. P = 0.047.
Figure 5
Figure 5. Hypothalamic localization of PRCP.
(A) Dark blue β-gal labeling representing LacZ expression in the place of PRCP in cells of the hypothalamus. Most labeled cells are in the vicinity of the DMH, perifornical region (pf), LH, and zona incerta (ZI). A few labeled cells are also visible in the arcuate nucleus (ARC) of the mediobasal hypothalamus. f, fornix; III, third ventricle. (B) Corresponding to the LacZ expression shown in A, in situ hybridization for PRCP mRNA in wild-type animals resulted in labeled cells (dark-field micrograph; white dots represent digoxigenin labeling of antisense mRNA probe) in the DMH, pf, LH, and ZI, with a few labeled cells also present in the ARC. (CF) Double labeling for β-gal (LacZ) and MCH or Hcrt revealed extensive coexpression of PRCP and MCH (C) and PRCP and Hcrt in the LH perifornical region (D). A few cells expressing POMC were also found to express LacZ (representing PRCP) in the arcuate nucleus (F). (E) LacZ-positive boutons in close proximity to α-MSH–immunopositive terminals in the hypothalamic PVN. Red arrows indicate double-labeled cells; black arrows point to single-labeled LacZ-expressing cells; and black arrowheads indicate single-labeled POMC, MCH, or Hcrt neurons. Scale bar in A (also applies to B): 100 μm. Scale bar in C (also applies to D and F): 10 μm. Scale bar in E: 2 μm.
Figure 6
Figure 6. Effect of α-MSH1–13 and α-MSH1–12 on food intake.
(A) Graph showing the effect of i.c.v. injection of 2.5 μg of α-MSH1–13 and α-MSH1–12 on food intake compared with saline control (n = 6 in both groups). Means (± SEM) were compared using 1-way ANOVA followed by the Student-Newman-Keuls method. *P = 0.006. (B and C) Electrophysiology results of α-MSH1–13 (B) and α-MSH1–12 (C) on GFP-MC4R neurons of the PVN of the hypothalamus (n = 9). Data represent the mean ± SEM. P = 0.024. (D) Effect of i.c.v. administration of vehicle and 0.9 mg BPP on food intake of fasted rats (n = 6 for each group). Data represent the mean ± SEM. Statistical analysis was performed by unpaired t test. P = 0.016. (E) Percentage of food intake in Lepob/ob mice injected i.p. with vehicle (white bars; n = 5) and with 400 μg of BPP (black bars; n = 5). Data represent the mean ± SEM. Statistical analysis was performed by unpaired t test. #P = 0.022, ##P = 0.039. (F) Inhibitory effect on food intake of i.p. administration of ZPP. ZPP produced a specific dose-responsive inhibition of food intake in overnight-fasted mice. Significance value indicated for individual time points represents 100 mg/kg BW versus vehicle. Data represent the mean ± SEM. **P = 0.0025, §P < 0.05. (G) Percentage of food intake in Lepob/ob mice injected i.p. with vehicle (white bars; n = 5) and with 100 mg/kg BW of ZPP (black bars; n = 5). The data represent the mean ± SEM. Statistical analysis was performed by unpaired t test. P = 0.006, ††P = 0.047. (H) Intracerebroventricularly injected SHU9119 (6 nmol) specifically blocks ZPP inhibition of food intake. Significance value indicated for individual time point represents vehicle/ZPP versus SHU9119/ZPP. Data represent the mean ± SEM. ‡‡P = 0.0025 for treatment and P = 0.0002 for time points.
Figure 7
Figure 7. Schematic illustration showing that hypothalamic PRCP is in an anatomical position to determine the efficacy of released α-MSH1–13, thereby controlling the output of the melanocortin system.
We found that PRCP is mainly expressed in the lateral hypothalamic Hcrt and MCH neurons. These neurons project to various areas of the hypothalamus, such as the PVN, where α-MSH1–13 terminals strongly innervate MC4R-expressing neurons. It is our hypothesis that PRCP, once released from the Hcrt and/or MCH terminals, will degrade α-MSH, thus increasing the antagonist effect of agouti-related protein (AgRP) and enhancing the orexigenic tone of the system. In support of this, congenic mice and PRCPgt/gt mice are leaner than the wild-type controls. GHS-R/LR, growth hormone secretagogue receptor/leptin receptor; NPY, neuropeptide Y.

Comment in

Similar articles

Cited by

References

    1. Muramatsu Y., et al. Pnlip encoding pancreatic lipase is possible candidate for obesity QTL in the OLETF rat. Biochem. Biophys. Res. Commun. 2005;331:1270–1276. doi: 10.1016/j.bbrc.2005.04.040. - DOI - PubMed
    1. Watanabe T.K., et al. Mutated G-protein-coupled receptor GPR10 is responsible for the hyperphagia/dyslipidaemia/obesity locus of Dmo1 in the OLETF rat. Clin. Exp. Pharmacol. Physiol. 2005;32:355–366. doi: 10.1111/j.1440-1681.2005.04196.x. - DOI - PubMed
    1. Stylianou I.M., et al. Microarray gene expression analysis of the Fob3b obesity QTL identifies positional candidate gene Sqle and perturbed cholesterol and glycolysis pathways. Physiol. Genomics. 2005;20:224–232. - PubMed
    1. Williams D.L., Schwartz M.W. The melanocortin system as a central integrator of direct and indirect controls of food intake. Am. J. Physiol. Regul. Integr. Comp. Physiol. 2005;289:R2–R3. - PubMed
    1. Wilkinson C.W. Roles of acetylation and other post-translational modifications in melanocortin function and interactions with endorphins. Peptides. 2006;27:453–471. doi: 10.1016/j.peptides.2005.05.029. - DOI - PubMed

Publication types

MeSH terms