. 2009 Aug;119(8):2143-59.
doi: 10.1172/JCI37884. Epub 2009 Jul 20.

Monoclonal antibodies directed to CD20 and HLA-DR can elicit homotypic adhesion followed by lysosome-mediated cell death in human lymphoma and leukemia cells

Affiliations

Monoclonal antibodies directed to CD20 and HLA-DR can elicit homotypic adhesion followed by lysosome-mediated cell death in human lymphoma and leukemia cells

Andrei Ivanov et al. J Clin Invest. 2009 Aug.

Abstract

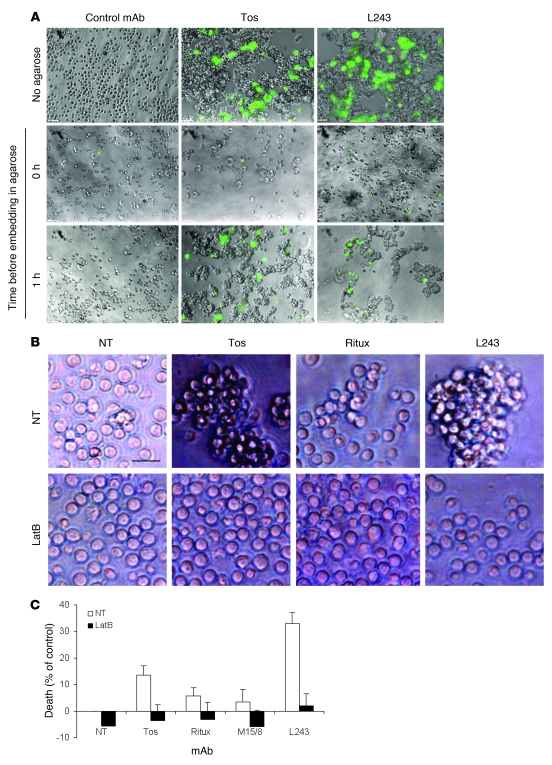
mAbs are becoming increasingly utilized in the treatment of lymphoid disorders. Although Fc-FcgammaR interactions are thought to account for much of their therapeutic effect, this does not explain why certain mAb specificities are more potent than others. An additional effector mechanism underlying the action of some mAbs is the direct induction of cell death. Previously, we demonstrated that certain CD20-specific mAbs (which we termed type II mAbs) evoke a nonapoptotic mode of cell death that appears to be linked with the induction of homotypic adhesion. Here, we reveal that peripheral relocalization of actin is critical for the adhesion and cell death induced by both the type II CD20-specific mAb tositumomab and an HLA-DR-specific mAb in both human lymphoma cell lines and primary chronic lymphocytic leukemia cells. The cell death elicited was rapid, nonapoptotic, nonautophagic, and dependent on the integrity of plasma membrane cholesterol and activation of the V-type ATPase. This cytoplasmic cell death involved lysosomes, which swelled and then dispersed their contents, including cathepsin B, into the cytoplasm and surrounding environment. The resulting loss of plasma membrane integrity occurred independently of caspases and was not controlled by Bcl-2. These experiments provide what we believe to be new insights into the mechanisms by which 2 clinically relevant mAbs elicit cell death and show that this homotypic adhesion-related cell death occurs through a lysosome-dependent pathway.


Figures

Figure 1
Figure 1. Actin-dependent HA is involved in cell death evoked by mAbs directed against CD20 or HLA-DR.
(A) Raji cells were incubated with various mAbs (10 μg/ml) for 4 to 6 hours, at which point HA was assessed by light microscopy. The number of plus signs indicates the strength/extent of adhesion as assessed semiquantitatively by microscopic visualization. 20 hours later, samples were assessed for the extent of cell death following staining with AnV-FITC (AnV) and propidium iodide (PI) and flow cytometry. Bars represent the mean cell death (AnV- and PI-positive cells) + SEM from 3 to 7 independent experiments. Representative data are shown in B. A typical “apoptotic” plot is shown for reference following treatment of Raji cells with 4 Gy irradiation. Tos, tositumomab; Ritux, rituximab; NT, no treatment. (C) Raji cells were treated with various actin inhibitors prior to the addition of anti-CD20 or HLA-DR mAbs, and cell death was assessed 4 hours later as previously described. (D) Inhibitor of actin cytoskeleton at noncytotoxic concentrations protects cells from long-term cytotoxicity evoked by both anti-CD20 and HLA-DR mAbs. Prior to the addition of various mAbs (5 μg/ml), Raji cells were treated for 45 minutes with cytochalasin D (CytoD; 0.1 μM). Cell viability was assessed 24, 48, and 72 hours later using Cell Proliferation Kit II (sodium 3′-[1-(phenylaminocarbonyl)-3,4-tetrazolium]-bis (4-methoxy-6-nitro) benzene sulfonic acid hydrate [XTT] assay; Roche). Plot represents mean metabolic activity relative to nontreated control from 2 independent experiments run in 3 technical replicates. Data shown represent mean + SEM. (E) Raji cells were treated with DMSO or the actin inhibitor latrunculin B (LatB; 10 μM) prior to the addition of Tos or L243 (10 μg/ml) and assessed for HA 4 to 6 hours later. Original magnification, ×20. Together, these data clearly demonstrate that cell death evoked by both anti-CD20 and HLA-DR mAbs is dependent upon adhesion and that both these processes are dependent upon actin.
Figure 2
Figure 2. Direct involvement of HA in cell death evoked by CD20 and HLA-DR mAbs.
(A) Cells were treated with tositumomab or L243 mAbs, plated as usual or embedded either immediately or 1 hour later in low–melting point agarose containing SYTOX Green nuclear stain to prevent cell-cell association, and assessed by fluorescence microscopy 4 hours after treatment. Scale bars: 100 μm. (B) CLL cells were treated or not with the actin inhibitor latrunculin B (10 μM) for 45 minutes prior to the addition of various mAbs (10 μg/ml) for 18 hours, when HA was assessed by light microscopy. A typical example of the results is demonstrated. Scale bar: 40 μm. (C) The same samples were then assessed for the extent of cell death following staining with AnV-FITC and PI and flow cytometry. Bars represent the mean cell death (AnV- and PI-positive cells) above cell death observed in the untreated samples + SEM from 7 different CLL samples. Due to heterogeneous levels of basal apoptosis in the CLL samples, these data were expressed as percentage of cell death above control. These data clearly demonstrate that adhesion and death evoked by both anti-CD20 and HLA-DR mAbs in CLL samples are dependent upon actin.
Figure 3
Figure 3. Involvement of microvilli and plasma membrane cholesterol in mAb-induced HA.
(A) Raji cells were incubated with tositumomab or L243 Abs (10 μg/ml) for 1 hour. Then samples were collected and processed for TEM as described in Methods. Left panel shows the early stage of intercellular adhesion of Raji cells. Scale bar: 2 μm. Right panel shows high-power view of the area shown in the square demonstrating the involvement of microvilli in HA of Raji cells. Scale bar: 0.5 μm. (B) Assessment of plasma membrane cholesterol in MCD-pretreated Raji cells. MCD-treated cells were harvested and stained with FITC-labeled CTB and assessed by flow cytometry. The prominent reduction of plasma membrane cholesterol observed in MCD-treated cells (MCD) could be reversed by coincubation of cells with cholesterol (MCD/cholesterol). CTB unlabeled cells are shown as a background control (background). (C) Raji cells were pretreated with 10 μM MCD for 30 minutes, then washed and incubated with tositumomab or L243 Abs (10 μg/ml) for 4 hours. Then aggregation of cells was assessed by inverted phase contrast microscopy. Scale bar: 150 μm. (D) Involvement of plasma membrane cholesterol in anti-CD20– and anti–HLA-DR–induced cell death. Plasma membrane cholesterol was modulated as described in B and C and then cells were incubated with Abs (10 μg/ml) or in HBSS. Cell death was assessed 4 hours later. Data represent the average of at least 2 independent experiments + SEM. *P < 0.01; **P < 0.003.
Figure 4
Figure 4. Peripheral relocalization of cellular actin in cells undergoing HA after treatment with tositumomab.
(A) Raji cells were incubated with the anti-CD20 Ab tositumomab or L243 (10 μg/ml), washed, and sedimented onto poly-l-lysine–coated microscope slides. After fixation with 1% paraformaldehyde in PBS, cells were stained with Alexa Fluor 594–labeled phalloidin (red). DNA was counterstained with DAPI (blue). Lower panels represent higher-power images. Scale bars: 60 μm. (B) Time-lapse microscopy of Raji cells expressing AcGFP-labeled actin. After addition of tositumomab or L243 (10 μg/ml), cell suspensions were put into a glass-bottom Petri dish and assessed at 37°C under inverted time-lapse microscopy. Images were obtained every 2 minutes (see Supplemental Video 1). The interval between images displayed is 6 minutes, except for between the final 2 images (50 minutes). Scale bars: 15 μm. (C) The total amount of cellular actin was assessed by Western blotting. α-tubulin was assessed as a loading control. Samples were taken 24 hours after stimulation. (D) Image analysis of F-actin signal area following treatment with control mAbs (OKT3) or tositumomab. Cells were sedimented onto poly-l-lysine–coated slides and stained with phalloidin–Alexa Fluor 594; images were taken. The area of Alexa Fluor–positive signal was then measured using Image-Pro Plus software, version 6.3 (Media Cybernetics), and expressed graphically.
Figure 5
Figure 5. Lateral mobility of cellular actin, formation of syncytium, and polarization of mitochondria in cells undergoing HA.
(A) AcGFP-actin–expressing Raji cells were treated with either control mAbs (OKT3), tositumomab, or L243 (all at 10 μg/ml) for 4 hours, then studied by FRAP, with flurorescence recovery assessed for 100 seconds. Typical image data is shown for control- and tositumomab-treated cells. Upper panels: virtually no recovery was observed in control mAb–treated cells. Lower panels (Tos): recovery of junctional actin within the cell-to-cell contact area was observed after approximately 80 seconds. Scale bars: 20 μm. Squares indicate regions targeted for photobleaching. (B) Typical fluorescence recovery pattern of AcGFP-actin after photobleaching. Control cells showed no recovery within 100 seconds (left). Recovery of junctional actin fluorescence was shown within 80 seconds after photobleaching in cells treated with anti-CD20 (Tos; center) and anti–HLA-DR (L243; right). (C) Transient cytoplasmic bridges between cells undergoing HA. Phase contrast time-lapse microscopy of Raji cells treated with tositumomab (10 μg/ml). Intervals between images are 5 minutes. Arrows indicate location of bridge formation. Scale bar: 20 μm. (D and E) Peripheral relocalization of mitochondria toward cell-to-cell contact area as assessed by TEM (D) and JC-1 staining (E). Arrows indicate localized mitochondria. Scale bar: 10 μm. (E) JC-1–labeled cells were treated with tositumomab or L243 (10 μg/ml). After that, images were captured detecting monomeric (green) and J-aggregate (red) forms of JC-1. Arrows indicate J-aggregate mitochondria at cell-cell junctions. Scale bars: 10 μm (D); 20 μm (E). (F) Time-lapse video microscopy of JC-1–labeled cells. Red mitochondria represent mitochondria with high membrane potential, migrating toward cell-to-cell contact areas. Interval between images is 1 hour. Scale bar: 20 μm.
Figure 6
Figure 6. CD20-induced HA is accompanied by plasma membrane exchange and correlates with cell death.
(A) Raji cells were labeled with PKH26 (red), mixed with pGFP-actin–expressing (green) Raji cells, and treated with 10 μg/ml tositumomab or L243 and examined by fluorescence microscopy after 24 hours. Scale bars: 20 μm. (B) Flow cytometry profiles of membrane exchange using PKH26-labeled and YFP-expressing cells (right) and PKH26-labeled and GFP-actin–expressing cells (left) at 24 hours after treatment with tositumomab or L243. Values indicate the percentage of cells double positive for PKH26 and AcGFP. (C) Correlation between cell death and membrane exchange. The data clearly demonstrate that type II anti-CD20 and HLA-DR mAbs stimulate transfer of plasma membrane material between adhering cells whereas other mAbs do not. This property is independent of Fc-FcγR interactions, occurring equivalently with F(ab)′2 fragments, and was correlated with the extent of cell death induced. Data shown are mean + SEM. (D) Similar proportion of cell death in overall population and in cells having undergone plasma membrane exchange. Left panel: cell death was assessed by Cy5.5-labeled annexin V in FL4 channel of FACScalibur 4 hours after treatment with L243. The histogram represents the pattern of annexin V positivity (M1 region) in the overall cell population (black) and in the population of dual-positive cells (PKH26/PKH67; green). Red histogram shows control-treated cells. Right panel: numerical data representing the proportion of cell death in dually PKH26/PKH67-positive cells and in the overall cell population in 2 independent experiments + SEM. The data show no enrichment of cell death in the cells that have undergone membrane exchange.
Figure 7
Figure 7. Cell death evoked by tositumomab and L243 is nonapoptotic and nonautophagic.
(A) Raji cells, either WT or overexpressing Bcl-2, were treated with mAbs (10 μg/ml) or mitoxantrone (1 μg/ml) in the presence (black columns) or absence (white columns) of the pan-caspase inhibitor QVD-OPH (20 μM) as indicated for 24 hours and then assessed for cell death as before. (B) Raji cells were treated for 24 hours (left panel) with various mAbs (10 μg/ml) or treated for 2 hours, 4 hours, or 8 hours with various mAbs (right panel) and then assessed by Western blot for the expression of Beclin-1, Atg12, ezrin, or actin (the latter 2 as loading controls). Irr, irrelevant treated; M, M15/8. (C) Raji cells were nucleofected with siRNA to Atg12 or Beclin-1 and then incubated for 24 hours. Subsequently, cells were treated with mAbs (10 μg/ml) and assessed for cell death as previously described. The degree of knockdown was verified 48 hours after nucleofection by Western blot (inset). B2 and B3 refer to 2 different targeting regions of Beclin-1. (D) Raji cells were preincubated with TPCK, trypsin-like serine proteases (TLCK), or Y27632 (20 μM) before being treated with tositumomab or L243; cell death was measured 24 hours later. We performed similar experiments with inhibitors over a 50-fold dilution range from 1 to 50 μM with identical results.
Figure 8
Figure 8. Morphological pattern of cell death induced by anti-CD20 mAb tositumomab.
(A and B) Gross vacuolization of cytoplasm (arrows) with relatively intact nuclei (N) is a typical TEM pattern of cell death in the presence of anti-CD20 (Tos) (A) and anti–HLA-DR (L243) Abs (B). (C) Morphology of control, nontreated cell and (D) classical apoptosis. (EJ) Scanning EM figures of tositumomab-treated Raji cells. Scale bars: 10 μm (A, B, and EJ); 5 μm (C and D). (E) Loss of microvilli was a typical feature of tositumomab-treated cells at the 4-hour time point. (F) Complete permeabilization and decomposition of cytoplasm was observed at 24 hours after treatment (10 μg/ml). (G) HA of Raji cells following treatment with tositumomab (10 μg/ml). (H) Section in the square from G enlarged. Arrow shows nonapoptotic cell death of aggregated cell. (I) Nontreated cell and (J) morphological control of apoptosis after treatment with cycloheximide for 24 hours (50 μg/ml).
Figure 9
Figure 9. Involvement of lysosomes in anti-CD20 and anti–HLA-DR–induced cell death.
(A) Detection of total lysosomal volume in cells treated with mAbs. Cells were incubated with anti-CD20 mAb tositumomab or anti–HLA-DR mAb L243 as described previously (10 μg/ml). After that, cells were labeled with LysoTracker red and the volume of the lysosomal compartment measured by flow cytometry and fluorescence microscopy after 1 hour or 4 hours. Insert: L243-treated cell displaying a single large lysosome. (B) Relationship between lysosomal volume and cell death. Cells were treated as in A and subsequently, after 4 hours, costained with annexin V–Cy5.5 and assessed by 2-channel flow cytometry. (C) Detection of lysosomal membrane permeabilization followed by permeabilization of cytoplasm. Cells were treated with mAbs as described above and then stained with acridine orange (AO). The relative increase or decrease in FL1 fluorescence was assessed by flow cytometry. (D) Permeabilization of plasma membrane as detected by destained cytoplasm (arrows) of tositumomab-treated cells. Cells were stained with AO as described and then assessed by fluorescence microscopy. Original magnification, ×40. (E) Confocal microscopy of cathepsin B staining (red) 4 hours after treatment with tositumomab or L243 mAbs. DNA was counterstained with DAPI (blue). Bottom right-hand panel shows L243-treated cells costained with cathepsin B (red) and LAMP-1 (green) with control-treated cells shown in the insert. A gross increase in the cathepsin B signal and peripheral localization of LAMP-1 (arrows) was observed. Scale bars: 20 μm. (F) The impact of cathepsin inhibitor III on cell death induced by tositumomab and L243. Cells were pretreated with different concentrations of inhibitor, and cell death (percentage of annexin V–FITC/PI–positive cells) was assessed 4 hours after treatment. Data represent the average of 3 independent experiments + SEM.
Figure 10
Figure 10. Lysosome-mediated cell death evoked by tositumomab and L243 is blocked by inhibitors of V-ATPase.
Raji cells were preincubated with concanamycin A (CMA) (0.01–100 nM) (A) or bafilomycin A1 (0–100 nM) (B) for 30 minutes before being treated with tositumomab or L243 (10 μg/ml). Cell death (AnV/PI+ cells) was measured 24 (A) or 4 (B) hours after treatment. (C) Inhibition of lysosomal V-type ATPase protects cells from long-term cytotoxicity induced by anti-CD20 and HLA-DR mAbs. Cells were pretreated with lysosomal V-type ATPase inhibitor concanamycin A (0.1 nM) for 45 minutes, and then mAbs were added. Cell viability was assessed 24, 48, and 72 hours later using an XTT assay (Roche). The plot represents mean metabolic activity relative to nontreated control from 2 independent experiments in 3 technical replicates. Data are shown as mean + SEM. (D) Impact of vATPase inhibitors on the volume of the cellular lysosomal compartment. Cells were incubated with concanamycin A (1 nM) or bafilomycin A1 (50 nM) for 30 minutes, and then mAbs were added (10 μg/ml). Subsequently, cells were labeled with LysoTracker red for 1 hour as described in Methods. Volume of lysosomal compartment was measured by flow cytometry as the magnitude of fluorescence in the FL2 channel. Level of fluorescence of Raji cells not labeled with LysoTracker (red histograms) was used as the reference control. Histograms represent FL2 fluorescence values of LysoTracker-labeled control cells with (green) or without (black) the indicated vATPase inhibitors as well as Ab-treated cells with (purple) or without (blue) vATPase inhibitors.

Comment in

Similar articles

Cited by

References

    1. Glennie M.J., Johnson P.W. Clinical trials of antibody therapy. Immunol. Today. 2000;21:403–410. doi: 10.1016/S0167-5699(00)01669-8. - DOI - PubMed
    1. Glennie M.J., van de Winkel J.G. Renaissance of cancer therapeutic antibodies. Drug Discov. Today. 2003;8:503–510. doi: 10.1016/S1359-6446(03)02714-4. - DOI - PubMed
    1. Cragg M.S., French R.R., Glennie M.J. Signaling antibodies in cancer therapy. Curr. Opin. Immunol. 1999;11:541–547. doi: 10.1016/S0952-7915(99)00010-2. - DOI - PubMed
    1. Glennie M.J., French R.R., Cragg M.S., Taylor R.P. Mechanisms of killing by anti-CD20 monoclonal antibodies. Mol. Immunol. 2007;44:3823–3837. doi: 10.1016/j.molimm.2007.06.151. - DOI - PubMed
    1. Chan H.T., et al. CD20-induced lymphoma cell death is independent of both caspases and its redistribution into triton X-100 insoluble membrane rafts. Cancer Res. 2003;63:5480–5489. - PubMed

Publication types

MeSH terms