. 2009 Aug;119(8):2171-83.
doi: 10.1172/JCI37622. Epub 2009 Jul 20.

RCP is a human breast cancer-promoting gene with Ras-activating function

Affiliations

RCP is a human breast cancer-promoting gene with Ras-activating function

Jinqiu Zhang et al. J Clin Invest. 2009 Aug.

Abstract

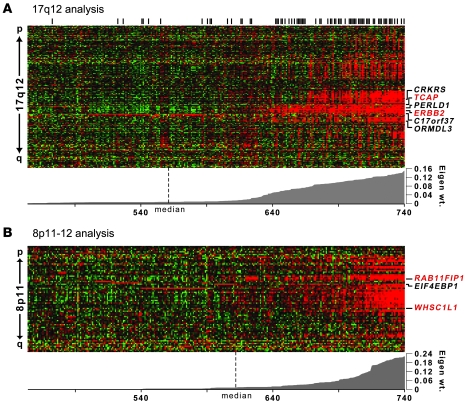
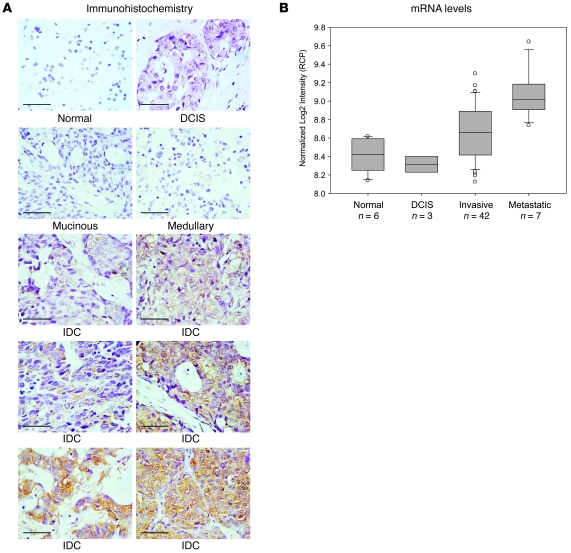
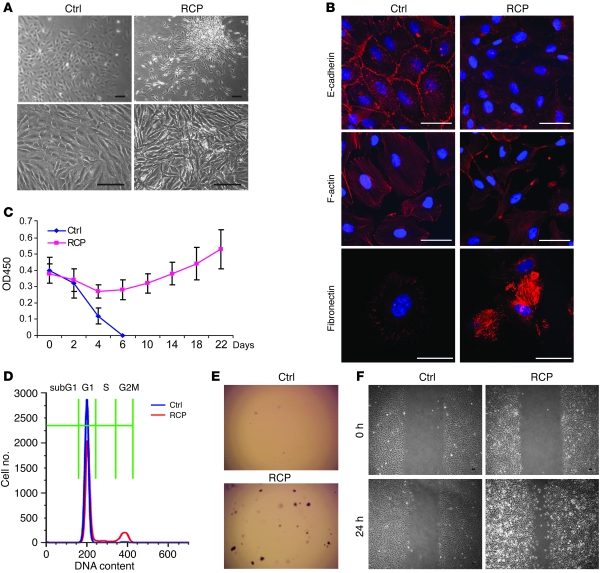
Aggressive forms of cancer are often defined by recurrent chromosomal alterations, yet in most cases, the causal or contributing genetic components remain poorly understood. Here, we utilized microarray informatics to identify candidate oncogenes potentially contributing to aggressive breast cancer behavior. We identified the Rab-coupling protein RCP (also known as RAB11FIP1), which is located at a chromosomal region frequently amplified in breast cancer (8p11-12) as a potential candidate. Overexpression of RCP in MCF10A normal human mammary epithelial cells resulted in acquisition of tumorigenic properties such as loss of contact inhibition, growth-factor independence, and anchorage-independent growth. Conversely, knockdown of RCP in human breast cancer cell lines inhibited colony formation, invasion, and migration in vitro and markedly reduced tumor formation and metastasis in mouse xenograft models. Overexpression of RCP enhanced ERK phosphorylation and increased Ras activation in vitro. As these results indicate that RCP is a multifunctional gene frequently amplified in breast cancer that encodes a protein with Ras-activating function, we suggest it has potential importance as a therapeutic target. Furthermore, these studies provide new insight into the emerging role of the Rab family of small G proteins and their interacting partners in carcinogenesis.


Figures

Figure 1
Figure 1. Graphical view of TRIAGE analysis of 17q12 and 8p11–12 amplicons.
Expression heat maps of the AEFs at (A) 17q12 and (B) 8p11–12 are shown. Tumors are arranged in columns, and genes identified by LSVD are organized in rows (in chromosomal order). Red color indicates above-mean gene expression; green denotes below-mean expression. Tumors are ranked by the absolute value of the eigenweight (shown below heat map). Genes with significant survival associations at TRIAGE step 3 are shown to the right. Genes in red indicate top oncogene candidates by TRIAGE (see Table 2). Black vertical bars above the heat map in A denote ERBB2 (HER2/neu) positivity by immunohistochemistry.
Figure 2
Figure 2. RCP expression correlates with breast cancer progression.
(A) Immunohistochemical staining of RCP in a panel of breast cancer tissues is shown. Scale bars: 50 μm. IDC, invasive ductal carcinoma. (B) Box plots are shown depicting RCP mRNA levels within each breast tissue/cancer type: (a) normal: noncancerous breast tissue from trauma victims (with no malignancy) or mastectomies (adjacent to tumor); (b) DCIS: noninvasive DCIS; (c) invasive: invasive carcinoma of ductal, lobular, medullary, and mixed histologies; and (d) metastatic: tumor metastases dissected from axillary lymph nodes. Boxes: upper and lower boundaries mark the 25th and 75th percentiles, respectively; internal line marks the median. Whiskers (error bars) mark the 10th (lower) and 90th (upper) percentiles, while all values outside of whiskers are shown as circles.
Figure 3
Figure 3. RCP induces oncogenic phenotypes in MCF10A cells.
MCF10A control (Ctrl) and RCP overexpressing (RCP) cell lines were assessed for the following biological parameters. (A) Cellular growth pattern and morphology. Scale bars: 100 μm. (B) Localization of E-cadherin at cell-cell junctions (top panels), organization of F-actin (middle panels), and expression of fibronectin under serum starvation conditions (bottom panels) by immunofluorescence. Scale bars: 50 μm. (C) Growth factor–independent proliferation assessed by WST (tetrazolium salt reduction) assay. Data shown represent mean ± SD. (D) Cell-cycle progression under serum starvation assessed by flow cytometry. (E) Anchorage-independent colony formation in soft agar (example). Original magnification, ×5. (F) Cell migration by wound healing (scratch) assay. Scale bars: 100 μm.
Figure 4
Figure 4. Oncogenic phenotypes of RCP in breast cancer cell lines.
(A) Effects of RCP overexpression and RNAi-mediated knockdown of RCP on cell proliferation by WST assay. Left panel shows results at 6 days after transfection. Middle panel shows proliferation time course of RCP overexpression in MCF10A cells. Right panel shows proliferation time course of RCP inhibition in MCF7 cells using 2 different RNAi RCP constructs and (scramble sequence) controls. (B) Effects of RCP overexpression and inhibition on anchorage-independent colony formation in soft agar. (C and D) Effects of RCP overexpression and inhibition on (C) cell invasion through matrigel and (D) cell migration. All error bars computed from mean ± SD. *P < 0.05; **P < 0.01; ***P < 0.001, Student’s t test (2-tailed).
Figure 5
Figure 5. RCP knockdown attenuates tumor formation and metastasis.
Effects of RCP inhibition on tumor growth using (A) MCF7 cells in nude mice and (B) MB231 cells in NOD-SCID mice are shown. (A) Left panel shows mean tumor volume plotted as a function of time (mean ± SEM). Right panel shows tumor weight plotted at 5 weeks; mean weight indicated by solid line. (B) Left panel, tumor weight plotted at indicated number of weeks; mean weight indicated by solid line. Right panel, the average number of lung micrometastases per section is shown. (C) Representative lung sections and fluorescently imaged whole lungs (right panel) of NOD-SCID mice are shown. Micrometastases are indicated by arrows. Scale bars: 200 μm.
Figure 6
Figure 6. RCP-mediated ERK phosphorylation and H-RAS activation.
(A) Western blots of H-RAS activation (GTP-bound H-RAS), total H-RAS, ERK phosphorylation status (P-Erk), total ERK, and RCP protein levels in MB231, MCF7, and MCF10A cells are shown in the context of RCP overexpression (RCP OE), RCP knockdown (RCP KD), and controls (CON). (B) Inhibition of RCP-mediated ERK phosphorylation in MCF10A cells by the MAPK inhibitor U0126 (upper panel) and U0126-mediated inhibition of the RCP proliferation phenotype (lower panel; mean ± SD).

Comment in

References

    1. Sorlie T., et al. Gene expression patterns of breast carcinomas distinguish tumor subclasses with clinical implications. Proc. Natl. Acad. Sci. U. S. A. 2001;98:10869–10874. doi: 10.1073/pnas.191367098. - DOI - PMC - PubMed
    1. van ‘t Veer L.J., et al. Gene expression profiling predicts clinical outcome of breast cancer. Nature. 2002;415:530–536. doi: 10.1038/415530a. - DOI - PubMed
    1. van de Vijver M.J., et al. A gene-expression signature as a predictor of survival in breast cancer. N. Engl. J. Med. 2002;347:1999–2009. doi: 10.1056/NEJMoa021967. - DOI - PubMed
    1. Sotiriou C., et al. Gene expression profiling in breast cancer: understanding the molecular basis of histologic grade to improve prognosis. J. Natl. Cancer Inst. 2006;98:262–272. - PubMed
    1. Ivshina A.V., et al. Genetic reclassification of histologic grade delineates new clinical subtypes of breast cancer. Cancer Res. 2006;66:10292–10301. doi: 10.1158/0008-5472.CAN-05-4414. - DOI - PubMed

Publication types

MeSH terms

Substances