. 2009 Aug;119(8):2399-411.
doi: 10.1172/JCI37155. Epub 2009 Jul 20.

Proapoptotic signaling induced by RIG-I and MDA-5 results in type I interferon-independent apoptosis in human melanoma cells

Affiliations

Proapoptotic signaling induced by RIG-I and MDA-5 results in type I interferon-independent apoptosis in human melanoma cells

Robert Besch et al. J Clin Invest. 2009 Aug.

Abstract

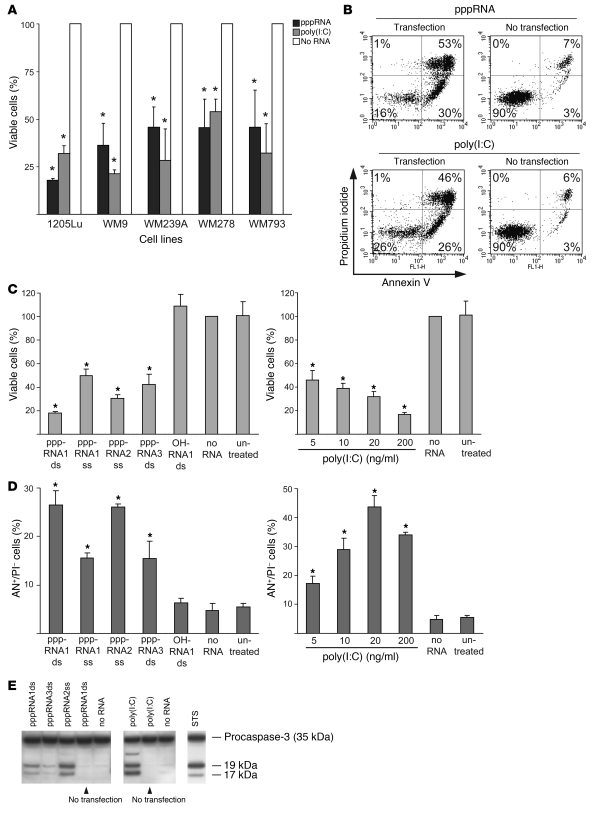
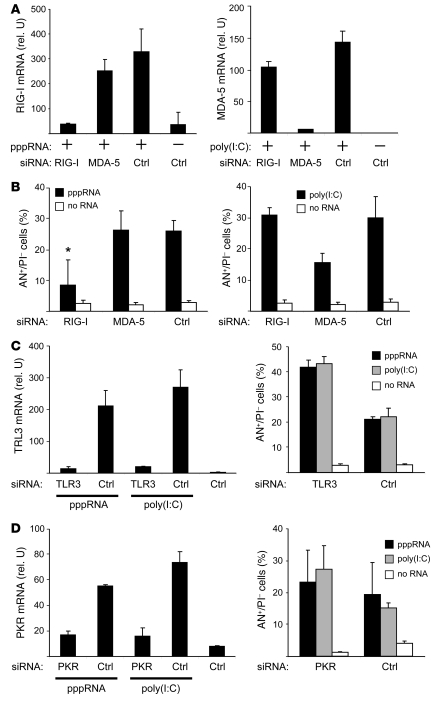
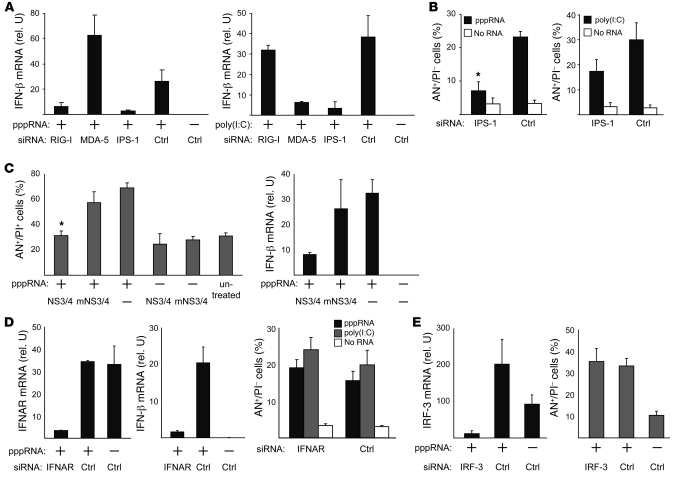
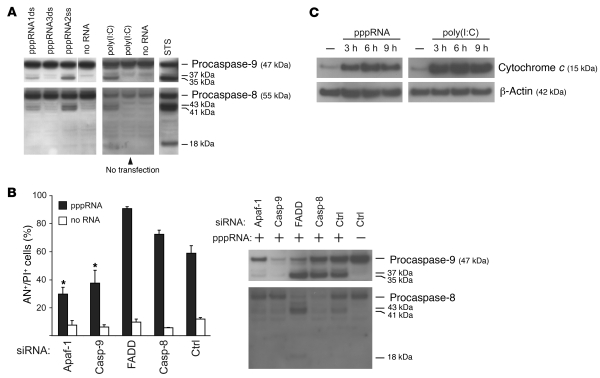
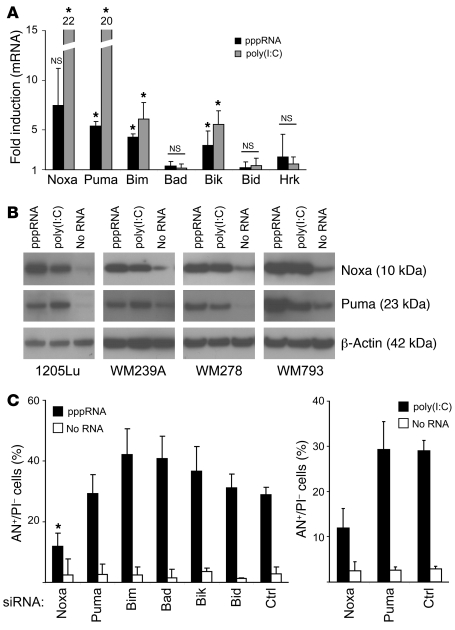
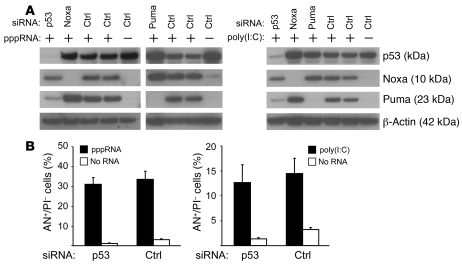
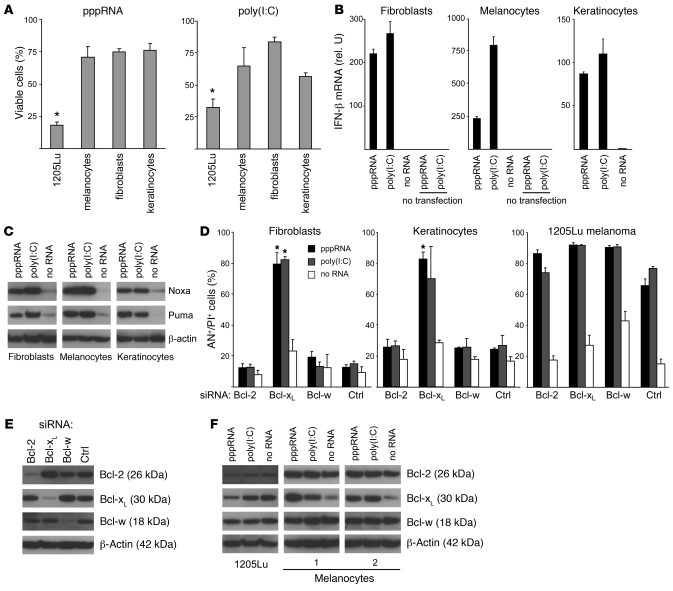
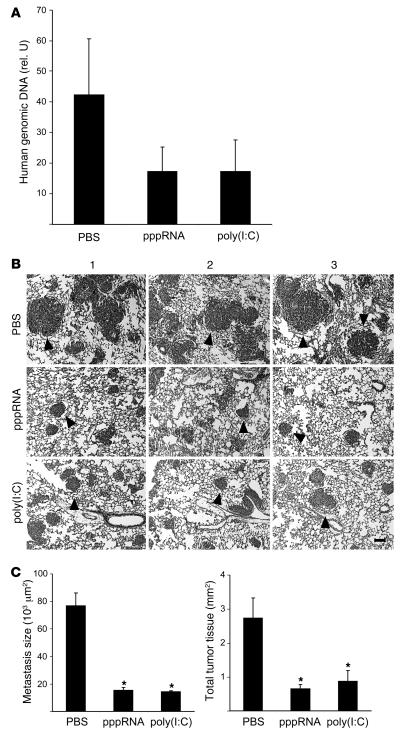
The retinoic acid-inducible gene I (RIG-I) and melanoma differentiation-associated antigen 5 (MDA-5) helicases sense viral RNA in infected cells and initiate antiviral responses such as the production of type I IFNs. Here we have shown that RIG-I and MDA-5 also initiate a proapoptotic signaling pathway that is independent of type I IFNs. In human melanoma cells, this signaling pathway required the mitochondrial adapter Cardif (also known as IPS-1) and induced the proapoptotic BH3-only proteins Puma and Noxa. RIG-I- and MDA-5-initiated apoptosis required Noxa but was independent of the tumor suppressor p53. Triggering this pathway led to efficient activation of mitochondrial apoptosis, requiring caspase-9 and Apaf-1. Surprisingly, this proapoptotic signaling pathway was also active in nonmalignant cells, but these cells were much less sensitive to apoptosis than melanoma cells. Endogenous Bcl-xL rescued nonmalignant, but not melanoma, cells from RIG-I- and MDA-5-mediated apoptosis. In addition, we confirmed the results of the in vitro studies, demonstrating that RIG-I and MDA-5 ligands both reduced human tumor lung metastasis in immunodeficient NOD/SCID mice. These results identify an IFN-independent antiviral signaling pathway initiated by RIG-I and MDA-5 that activates proapoptotic signaling and, unless blocked by Bcl-xL, results in apoptosis. Due to their immunostimulatory and proapoptotic activity, RIG-I and MDA-5 ligands have therapeutic potential due to their ability to overcome the characteristic resistance of melanoma cells to apoptosis.


Figures

Figure 1
Figure 1. pppRNA and poly(I:C) induce apoptosis in melanoma cells.
(A) The viability of different melanoma cell lines was determined after transfection of in vitro–transcribed RNA (pppRNA) or poly(I:C) (20 ng/ml). Cells were analyzed 17 (pppRNA) or 24 hours [poly(I:C)] after transfection. Viability of cells treated with transfection reagent alone (mock-transfected cells; No RNA) was set to 100%. *P ≤ 0.05 compared with the same cell line treated with transfection reagent alone. (B) Fluorescence-activated cell sorting (FACS) analysis of apoptotic 1205Lu cells treated with pppRNA or poly(I:C) (200 ng/ml) for 24 hours either complexed with a liposomal transfection reagent (Transfection) or not (No transfection). Percentages indicate the portion of cells in each quadrant that defines annexin V– or propidium iodide–positive or –negative cells. Results are representative of 3 independent experiments. (C) Left: Viability of the metastatic melanoma cell line 1205Lu was measured 24 hours after transfection of different short in vitro–transcribed RNAs (pppRNA1–3) in double-stranded (ds) or single-stranded (ss) form or synthetic unconjugated RNAs (OH) with the same sequence. Sequences of pppRNAs are shown in Methods. Right: Viability of 1205Lu cells transfected with different doses of poly(I:C) (20–200 ng/ml) for 24 hours. Viability of mock-transfected cells was set to 100%. (D) FACS analysis of apoptotic 1205Lu cells treated with pppRNA or poly(I:C) as described in C. Annexin V–positive and propidium iodide–negative cells (AN+/PI) are depicted. In A, C, and D, the mean ± SD of 3 independent experiments is shown. *P ≤ 0.05 compared with mock-transfected cells in C and D. (E) ppp­RNAs (pppRNA1–3) or poly(I:C) (5 ng/ml) were used with or without transfection reagent, and 1205Lu cells were analyzed 12 (pppRNA) or 24 hours [poly(I:C)] after treatment. Activation of caspase-3 was assessed by immunoblotting with an antibody specific for procaspase-3 (35 kDa) and its active cleaved subunits (17, 19 kDa). WM9 melanoma cells treated with 1 μM staurosporine (STS) for 5 hours served as a positive control for caspase cleavage. One representative of 3 independent experiments is shown.
Figure 2
Figure 2. Apoptosis induction in melanoma cells requires RIG-I and MDA-5.
(A) 1205Lu cells were treated with siRNAs specific for RIG-I or MDA-5 or with control siRNA (Ctrl) for 48 hours. Then cells were treated (+) with pppRNA or poly(I:C) (3 ng/ml) or with transfection reagent alone (–). Expression of RIG-I and MDA-5 mRNA was analyzed by quantitative RT-PCR. Mean ± SD of 3 independent experiments is shown. rel. U, relative units. (B) 1205Lu cells were treated with siRNAs and pppRNA or poly(I:C) (5 ng/ml) as described for A and analyzed for apoptosis by FACS. Annexin V–positive and propidium iodide–negative cells are represented. Mean ± SD of 3 independent experiments is shown. *P ≤ 0.05 compared with control siRNA–transfected cells treated with pppRNA. (C) 1205Lu cells were treated with siRNA specific for TLR3 or control siRNA and pppRNA, poly(I:C), or transfection reagent alone as described for A. Left: Quantification of TLR3 mRNA by quantitative RT-PCR. Right: Analysis of apoptotic cells. Mean ± SD of 3 independent experiments is shown. (D) 1205Lu cells were treated with siRNA specific for PKR or control siRNA and pppRNA, poly(I:C), or transfection reagent alone as described for A. Left: Quantification of PKR mRNA by quantitative RT-PCR. Right: Analysis of apoptotic cells. Mean ± SD of 3 independent experiments is shown.
Figure 3
Figure 3. Apoptosis as well as IFN-β induction by pppRNA and poly(I:C) are mediated via IPS-1 in melanoma, but apoptosis is independent of IFN-β secretion.
(A) 1205Lu cells were treated with pppRNA or poly(I:C) (3 ng/ml) 48 hours after transfection of siRNAs specific for RIG-I, MDA-5, or IPS-1 or control siRNA. IFN-β expression was analyzed by quantitative RT-PCR. (B) 1205Lu cells were treated with pppRNA or poly(I:C) (5 ng/ml) 48 hours after transfection of siRNAs specific for IPS-1 or control siRNA, and rates of apoptosis were determined by FACS. Annexin V–positive and propidium iodide–negative cells are represented. *P ≤ 0.05 compared with control siRNA–transfected cells treated with pppRNA1ds. (C) 1205Lu cells were transfected with vectors expressing wild-type NS3-4A (NS3/4) or an inactive mutant form (mNS3/4) (51). Twenty-four hours after vector transfection, cells were treated with pppRNA. Left: Apoptotic and dead cells (AN+/PI+) were measured. *P ≤ 0.05 compared with mNS3/4- or mock-transfected cells treated with pppRNA. Right: Analysis of IFN-β expression by quantitative RT-PCR. (D) 1205Lu cells were treated with siRNA specific for the type I IFN receptor (IFNAR) or control siRNA and pppRNA, poly(I:C), or transfection reagent alone as described for A. Left: quantification of IFNAR mRNA. Middle: Quantification of IFN-β expression. Right: FACS analysis of apoptotic cells (AN+/PI) treated with pppRNA, poly(I:C), or transfection reagent alone. (E) 1205Lu cells were treated with an IRF-3–specific siRNA or control siRNA and pppRNA as described for A. Left: Analysis of IRF-3 mRNA expression. Right: Analysis of apoptotic cells (AN+/PI). For all panels, mean ± SD of 3 independent experiments is shown.
Figure 4
Figure 4. RIG-I and MDA-5 activate the mitochondrial apoptosis pathway.
(A) Transfection of pppRNA or poly(I:C) activates the initiator caspase-9 and -8. pppRNAs (pppRNA1–3) or poly(I:C) (5 ng/ml) were used with or without transfection reagent, and 1205Lu cells were analyzed 12 (pppRNA) or 24 hours [poly(I:C)] after RNA treatment. Caspase activation was assessed by immunoblotting with antibodies that are specific for both procaspases and their respective active subunits. WM9 melanoma cells treated with 1 μM staurosporine (STS) for 5 hours served as a positive control for caspase cleavage. Blots are representative of 3 independent experiments. The last lane of the upper-left blot was run on the same gel but was not contiguous, as indicated by the white line. (B) 1205Lu cells were treated with pppRNA or transfection reagent alone 48 hours after transfection of siRNAs specific for Apaf-1, caspase-9, FADD, caspase-8, or control siRNA. Left: Apoptotic and dead cells (AN+/PI+) were analyzed. Mean ± SD of 3 independent experiments is shown. *P ≤ 0.05 compared with control siRNA–transfected cells treated with pppRNA. Right: Analysis of caspase-8 and -9 activation 12 hours after pppRNA transfection by immunoblotting as described for A. Blots are representative of 2 independent experiments. (C) 1205Lu cells were treated with pppRNA or poly(I:C) (5 ng/ml) or left untreated. Cytosolic protein fractions were prepared at the indicated time points (3, 6, or 9 hours after transfection) and analyzed for the presence of cytochrome c in the cytosol by immunoblotting. β-Actin served as loading control. Blots are representative of 2 independent experiments.
Figure 5
Figure 5. RIG-I and MDA-5 induce expression of the proapoptotic BH3-only members of the Bcl-2 family Noxa, Puma, Bim, and Bik.
(A) 1205Lu cells were treated with pppRNA or poly(I:C) (3 ng/ml) for 24 hours, and levels of Noxa, Puma, Bim, Bad, Bik, Bid, and Hrk mRNA were measured by quantitative RT-PCR. Relative mRNA levels compared with mock-transfected cells are depicted. Mean ± SD of 3 independent experiments is shown. *P ≤ 0.05 and NS compared with mock-transfected cells. (B) The melanoma cell lines 1205Lu, WM239A, WM278, and WM793 were treated with pppRNA or poly(I:C) (5 ng/ml), and Noxa and Puma proteins were quantified by immunoblotting. β-Actin served as loading control. Blots are representative of 2 independent experiments. (C) Left: Expression of the BH3-only proteins Noxa, Puma, Bim, Bad, Bik, and Bid was inhibited by treatment with respective siRNAs for 48 hours. Thereafter, cells were treated with pppRNA (left), poly(I:C) (5 ng/ml; right), or transfection reagent alone and analyzed for apoptotic cells by FACS. Annexin V–positive and propidium iodide–negative cells are represented. Mean ± SD of 3 independent experiments is shown. *P ≤ 0.05 compared with control siRNA–transfected cells treated with pppRNA.
Figure 6
Figure 6. Role of p53 in apoptosis induced by RIG-I and MDA-5.
(A) 1205Lu cells were treated with pppRNA or poly(I:C) 48 hours after transfection of siRNAs specific for p53, Noxa, Puma, or control siRNA and analyzed by immunoblotting. Left: Treatment with pppRNA. Blots are representative of 3 independent experiments. Right: Treatment with poly(I:C) (20 ng/ml). Blots are representative of 2 independent experiments. β-Actin served as loading control. (B) 1205Lu cells were transfected with a p53-specific siRNA or control siRNA for 48 hours, treated with pppRNA (left) or poly(I:C) (5 ng/ml; right) or transfection reagent alone, and analyzed for apoptotic cells (AN+/PI). Mean ± SD of 3 independent experiments is shown.
Figure 7
Figure 7. Increased apoptotic sensitivity of melanoma cells to RNA ligands of RIG-I and MDA-5.
(A) Cell viability of 1205Lu melanoma cells was compared with that of human melanocytes, primary human fibroblasts, or primary human keratinocytes. Cells were transfected with pppRNA or poly(I:C) (20 ng/ml) for 24 hours. The viability of mock-transfected cells was set to 100% for each cell type. Mean of 3 transfections of 1205Lu is indicated; the mean ± SEM of 2 or 3 donors measured in triplicate for primary cells is shown. *P ≤ 0.05 compared with melanocytes, fibroblasts, or keratinocytes. (B) Primary cells were treated with pppRNA, poly(I:C) (3 ng/ml) with or without transfection reagent, or with transfection reagent alone. IFN-β expression was analyzed by quantitative RT-PCR 17 hours after transfection. Mean ± SD of triplicate measurements of RNAs pooled from 3 (melanocytes) or 2 donors (fibroblasts and keratinocytes) is shown. (C) Primary cells were transfected with pppRNA for 17 hours or poly(I:C) (10 ng/ml) for 24 hours, and expression of Puma and Noxa protein was quantified by immunoblotting. Blots are representative of 3 independent experiments. (D) Primary fibroblasts, primary keratinocytes, or 1205Lu melanoma cells were treated with pppRNA, poly(I:C) (3 ng/ml), or transfection reagent alone 48 hours after transfection of siRNAs specific for antiapoptotic Bcl-2, Bcl-xL, Bcl-w, or control siRNA. Cell death was determined by FACS 17 hours after treatment with pppRNA or poly(I:C). Annexin V– and propidium iodide–positive cells are represented. Mean ± SD of 3 experiments with different donors for primary cells or different passages of 1205Lu cells is shown. *P ≤ 0.05, primary cells compared with cells transfected with control siRNA and the respective stimulus, pppRNA or poly(I:C). (E) Primary fibroblasts were treated with the indicated siRNAs and analyzed 48 hours after transfection by immunoblotting. Blots are representative of 3 independent experiments. (F) Expression of Bcl-2, Bcl-xL, and Bcl-w upon transfection with RIG-I and MDA-5 ligands. Melanocytes of 2 donors or 1205Lu melanoma cells were treated with pppRNA for 17 hours or poly(I:C) (10 ng/ml) for 24 hours. Expression was quantified by immunoblotting. Blots are representative of 3 independent experiments for 1205Lu melanoma cells. In C, E, and F, β-actin served as loading control.
Figure 8
Figure 8. Therapeutic efficacy of RIG-I and MDA-5 ligands in immunodeficient mice.
(A) Groups of 3 NOD/SCID mice were challenged with 4 × 10⁵ 1205Lu melanoma cells and treated intravenously on days 3, 6, and 9 with pppRNA, poly(I:C), or PBS complexed with jetPEI as described in Methods. Human genomic DNA, representative for lung metastases, was measured in triplicate by quantitative PCR in lungs isolated at day 10. The relative amount of genomic DNA was expressed as a ratio of the amount of murine genomic DNA determined in the same lung sample. Mean ± SEM of each group is depicted. (B) Groups of 3 NOD/SCID mice were challenged with 4 × 10⁵ 1205Lu melanoma cells and treated intravenously on days 3, 6, 9, and 20 with pppRNA, poly(I:C), or PBS as described in Methods. Analysis was done on day 24. Representative lung sections after H&E staining of individual mice of each group are shown. 1205Lu metastases are indicated by black arrowheads. Scale bar: 100 μm. (C) Left: Metastasis size was calculated from the diameter in histological sections as described in Methods. Mean metastasis size was determined for each mouse, and the mean of each group ± SEM is shown. Right: Total tumor burden was calculated as the sum of all metastasis areas in each mouse as described in Methods. Mean ± SD of each group is shown. *P ≤ 0.05 compared with PBS-treated mice.

Comment in

References

    1. Hanahan D., Weinberg R.A. The hallmarks of cancer. Cell. 2000;100:57–70. doi: 10.1016/S0092-8674(00)81683-9. - DOI - PubMed
    1. Tschopp J., Thome M., Hofmann K., Meinl E. The fight of viruses against apoptosis. Curr. Opin. Genet. Dev. 1998;8:82–87. doi: 10.1016/S0959-437X(98)80066-X. - DOI - PubMed
    1. Boon T., Coulie P.G., Van den Eynde B.J., van der Bruggen P. Human T cell responses against melanoma. Annu. Rev. Immunol. 2006;24:175–208. doi: 10.1146/annurev.immunol.24.021605.090733. - DOI - PubMed
    1. Kirkwood J.M., et al. High-dose interferon alfa-2b significantly prolongs relapse-free and overall survival compared with the GM2-KLH/QS-21 vaccine in patients with resected stage IIB-III melanoma: results of intergroup trial E1694/S9512/C509801. J. Clin. Oncol. 2001;19:2370–2380. - PubMed
    1. Parmiani G., et al. Immunotherapy of melanoma. Semin. Cancer Biol. 2003;13:391–400. doi: 10.1016/j.semcancer.2003.09.001. - DOI - PubMed

Publication types

MeSH terms