. 2009 Oct;54(4):298-309.
doi: 10.1097/FJC.0b013e3181b2b842.

Modulation of mitochondrial bioenergetics in the isolated Guinea pig beating heart by potassium and lidocaine cardioplegia: implications for cardioprotection

Affiliations

Modulation of mitochondrial bioenergetics in the isolated Guinea pig beating heart by potassium and lidocaine cardioplegia: implications for cardioprotection

Mohammed Aldakkak et al. J Cardiovasc Pharmacol. 2009 Oct.

Abstract

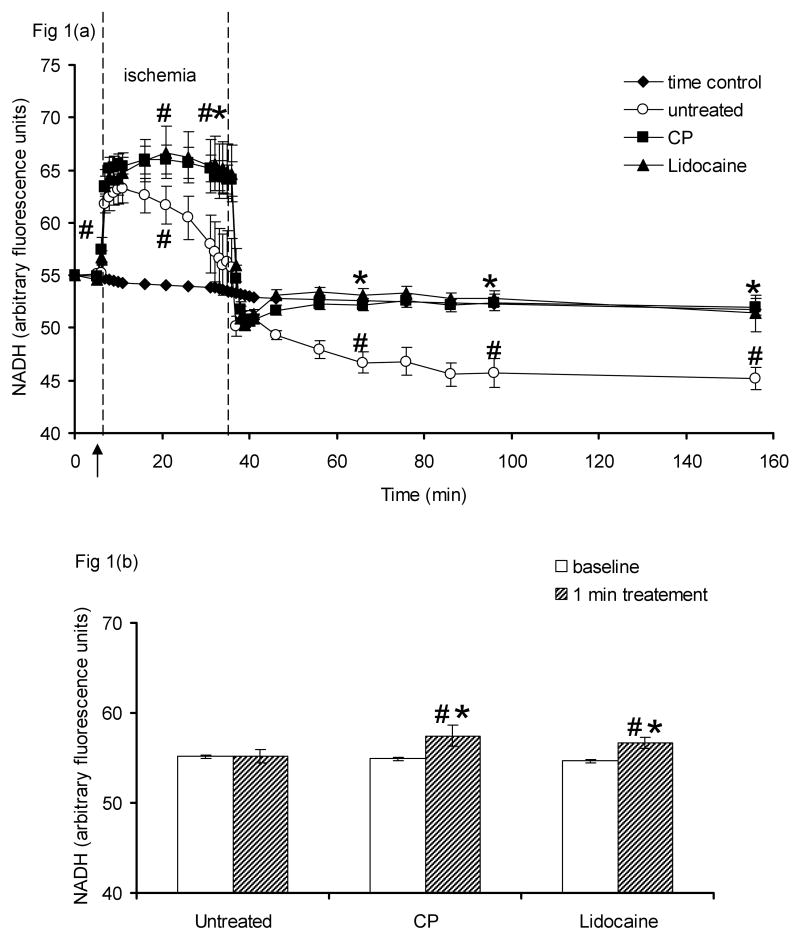
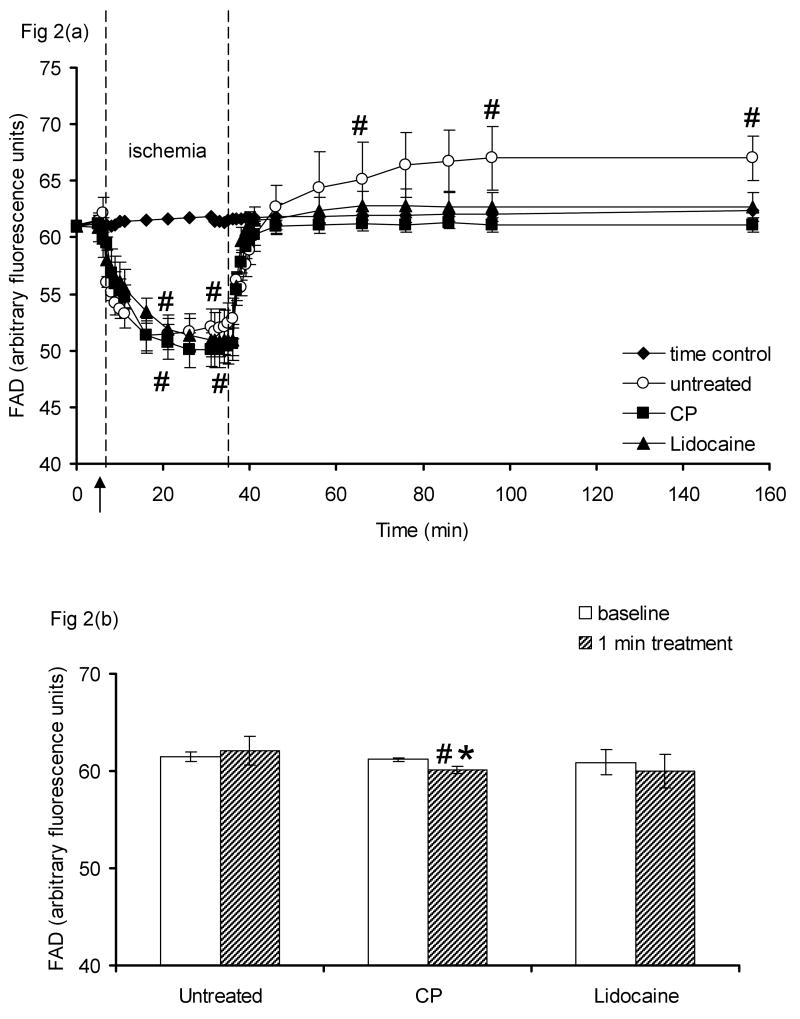
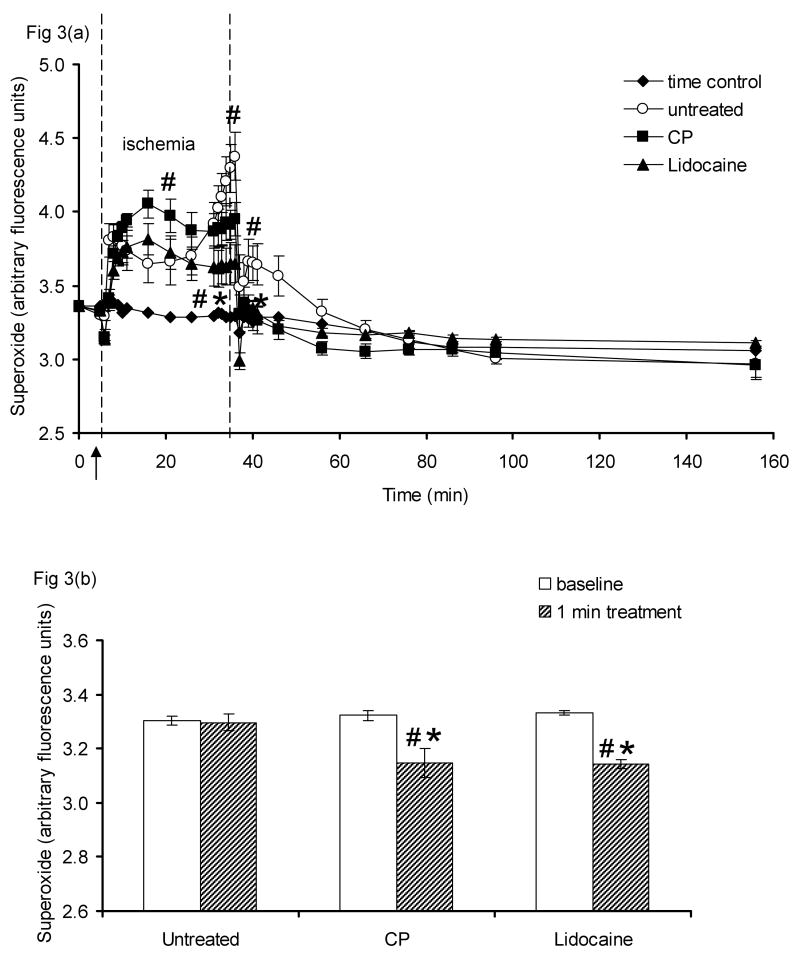
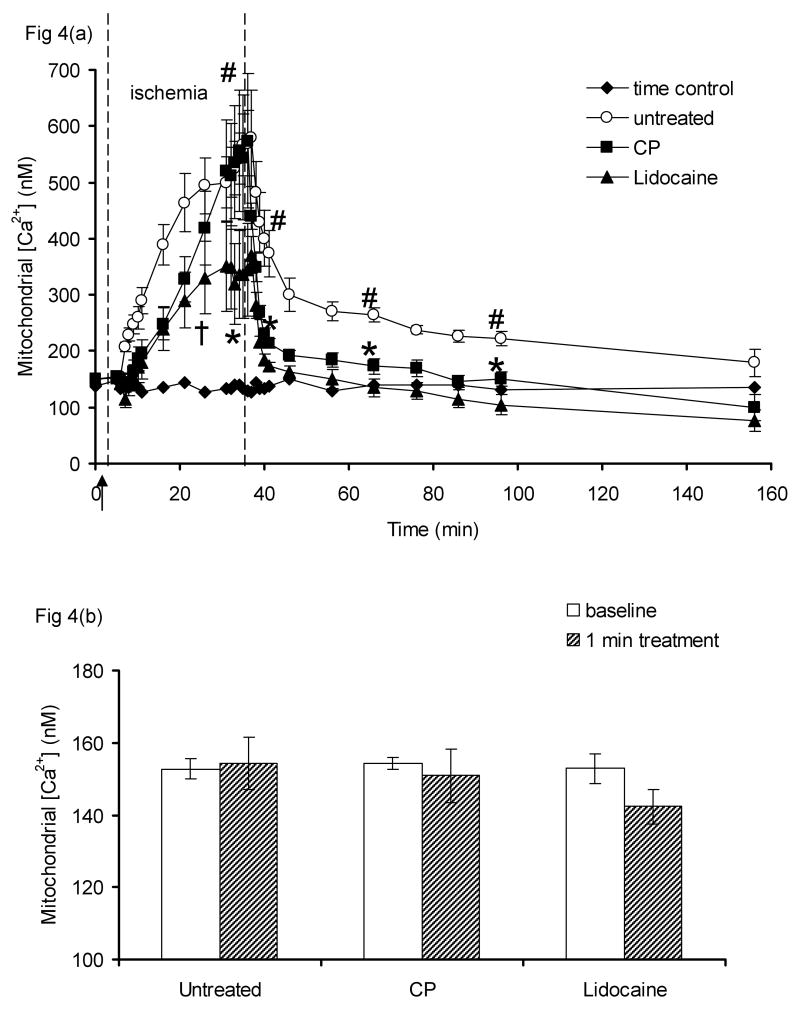
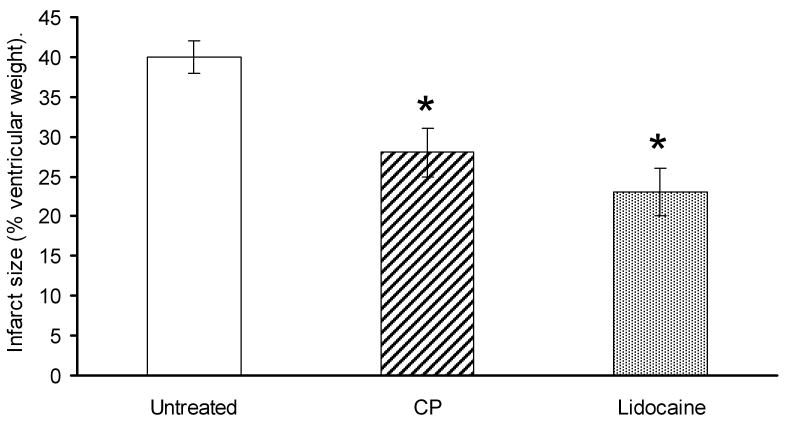
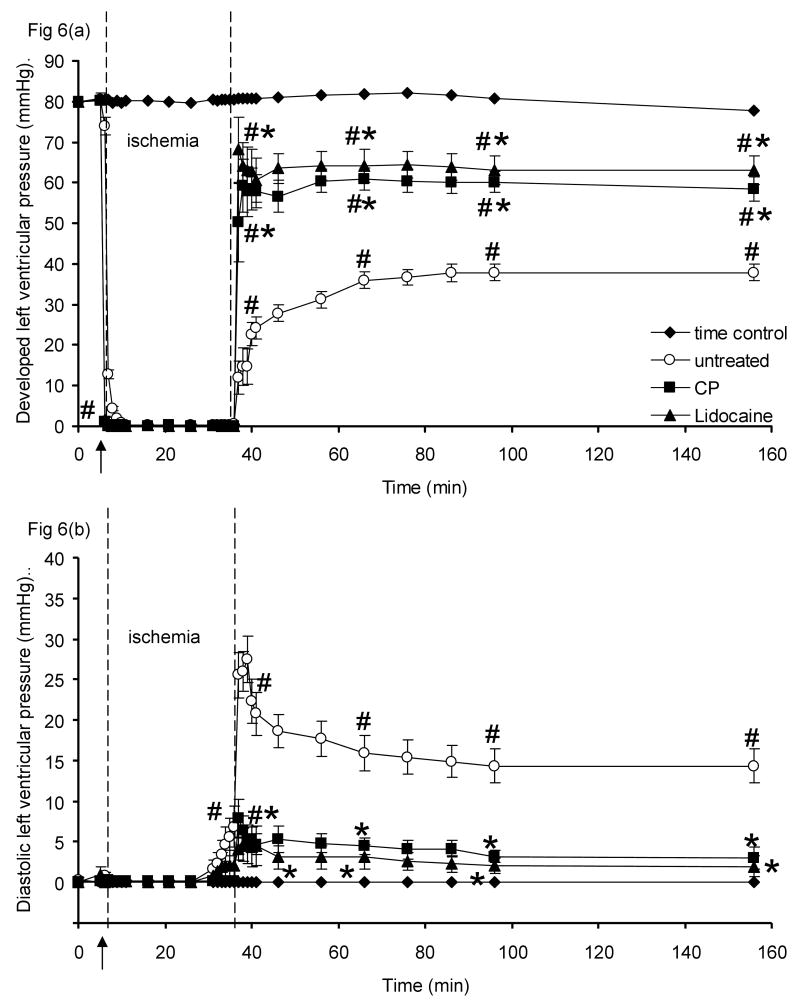
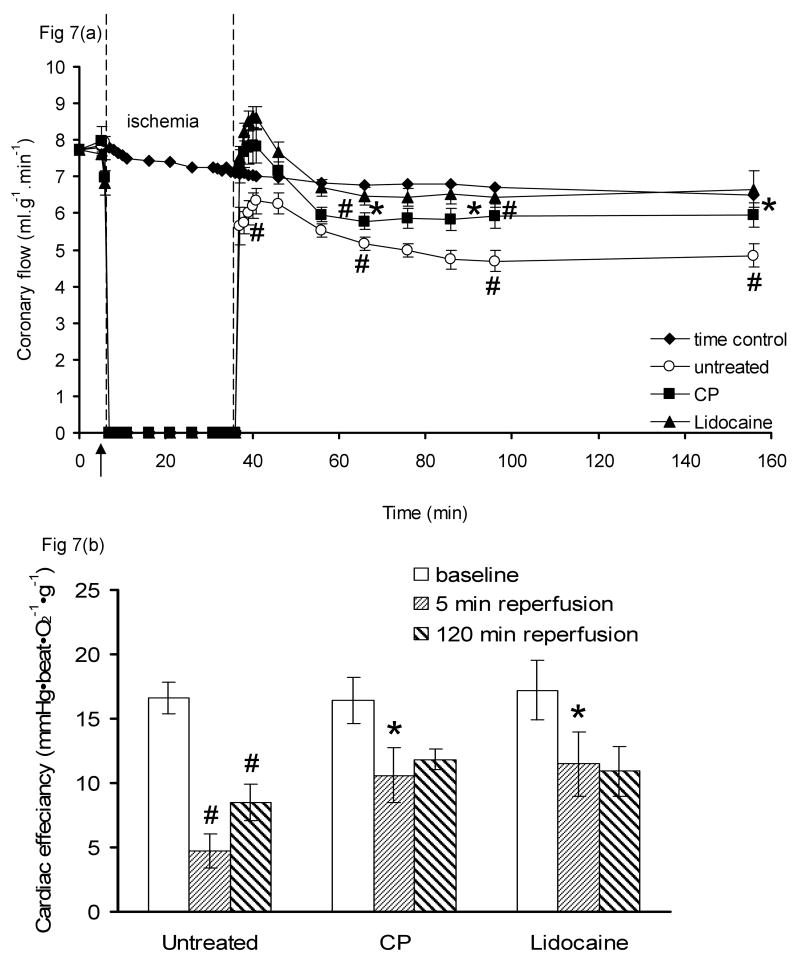
Mitochondria are damaged by cardiac ischemia/reperfusion (I/R) injury but can contribute to cardioprotection. We tested if hyperkalemic cardioplegia (CP) and lidocaine (LID) differently modulate mitochondrial (m) bioenergetics and protect hearts against I/R injury. Guinea pig hearts (n = 71) were perfused with Krebs Ringer's solution before perfusion for 1 minute just before ischemia with either CP (16 mM K) or LID (1 mM) or Krebs Ringer's (control, 4 mM K). The 1-minute perfusion period assured treatment during ischemia but not on reperfusion. Cardiac function, NADH, FAD, m[Ca], and superoxide (reactive oxygen species) were assessed at baseline, during the 1-minute perfusion, and continuously during I/R. During the brief perfusion before ischemia, CP and LID decreased reactive oxygen species and increased NADH without changing m[Ca]. Additionally, CP decreased FAD. During ischemia, NADH was higher and reactive oxygen species was lower after CP and LID, whereas m[Ca] was lower only after LID. On reperfusion, NADH and FAD were more normalized, and m[Ca] and reactive oxygen species remained lower after CP and LID. Better functional recovery and smaller infarct size after CP and LID were accompanied by better mitochondrial function. These results suggest that mitochondria may be implicated, directly or indirectly, in protection by CP and LID against I/R injury.


Conflict of interest statement

Conflict of interest: None.

Figures

Figure 1
Figure 1
(a). Change in NADH autofluorescence before, during, and after 30 min no flow, global ischemia for CON (n=5), CP (n=8), and LID (n=5) groups. Time control experiments (n=5) without concomitant ischemia are also shown. Arrow indicates 1 min CP or LID perfusion immediately before ischemia. Figure 1(b). Effect of CP or LID perfusion before ischemia on NADH; white and hatched bars represent baseline and 1 min of treatment. #P < 0.05, 1 min perfusion before ischemia, during ischemia and reperfusion vs. baseline values; *P < 0.05 CP or LID vs. CON; †P < 0.05 LID vs. CP (non significant, ns).
Figure 2
Figure 2
(a). Changes in FAD autofluorescence before, during, and after 30 min no flow, global ischemia for CON (n=5), CP (n=8), and LID (n=5) groups. Time control experiments (n=5) without concomitant ischemia are also shown. Arrow indicates 1 min CP or LID perfusion immediately before ischemia. Figure 2(b). Effect of CP or LID perfusion before ischemia on FAD; white and hatched bars represent baseline and 1 min of treatment. #P < 0.05, 1 min perfusion before ischemia, during ischemia and reperfusion vs. baseline values; *P < 0.05 CP or LID vs. CON; †P < 0.05 LID vs. CP (ns).
Figure 3
Figure 3
(a). Changes in superoxide (O2•-) levels before, during, and after 30 min no flow, global ischemia for CON (n=5), CP (n=6), and LID (n=6) groups. Time control experiments (n=5) without concomitant ischemia are also shown. Arrow indicates 1 min CP or LID perfusion immediately before ischemia. Figure 3(b). Effect of CP or LID perfusion before ischemia on O2•-; white and hatched bars represent baseline and 1 min of treatment. #P < 0.05, 1 min perfusion before ischemia, during ischemia and reperfusion vs. baseline values; *P < 0.05 CP or LID vs. CON; †P < 0.05 LID vs. CP (ns).
Figure 4
Figure 4
(a). Changes in m[Ca2+] before, during, and after 30 min no flow, global ischemia for CON (n=5), CP (n=6), and LID (n=7) groups. Time control experiments (n=5) without concomitant ischemia are also shown. Arrow indicates 1 min CP or LID perfusion immediately before ischemia. Figure 4(b). Effect of CP or LID perfusion before ischemia on m[Ca2+]; white and hatched bars represent baseline and 1 min of treatment. #P < 0.05, 1 min perfusion before ischemia, during ischemia and reperfusion vs. baseline values; *P < 0.05 CP or LID vs. CON; †P < 0.05 LID vs. CP.
Figure 5
Figure 5
Infarct size as a percentage of total ventricular weight measured after 120 min reperfusion for CON (n=15), CP (n=21), and LID (n=20). *P < 0.05 CP or LID vs. CON; †P < 0.05 LID vs. CP (ns).
Figure 6
Figure 6
Left ventricular developed pressure (systolic–diastolic LVP (a)), and diastolic left ventricular pressure (diaLVP (b)) before, during, and after 30 min no flow, global ischemia for CON (n= 10), CP (n=15), and LID (n=14) groups. Time control experiments (n=10) without concomitant ischemia are also shown. Arrow indicates 1 min CP or LID perfusion immediately before ischemia. #P < 0.05, 1 min perfusion before ischemia, during ischemia and reperfusion vs. baseline values; *P < 0.05 CP or LID vs. CON; †P < 0.05 LID vs. CP (ns).
Figure 7
Figure 7
(a). Coronary flow before, during, and after 30 min no flow, global ischemia for CON (n=10), CP (n=15), and LID (n=14) groups. Time control experiments (n=10) without concomitant ischemia are also shown. Arrow indicates 1 min CP or LID perfusion immediately before ischemia. Figure 7(b). Effects of CP and LID on cardiac efficiency at selected time points during reperfusion. #P < 0.05, 1 min perfusion before ischemia, during ischemia and reperfusion vs. baseline values; *P < 0.05 CP or LID vs. CON; †P < 0.05 LID vs. CP (ns).

Similar articles

Cited by

References

    1. Cleveland JC, Jr, Meldrum DR, Rowland RT, Banerjee A, Harken AH. Optimal myocardial preservation: cooling, cardioplegia, and conditioning. Ann Thorac Surg. 1996;61:760–768. - PubMed
    1. Roe BB, Hutchinson JC, Fishman NH, Ullyot DJ, Smith DL. Myocardial protection with cold, ischemic, potassium-induced cardioplegia. J Thorac Cardiovasc Surg. 1977;73:366–374. - PubMed
    1. Attwell D, Cohen I, Eisner D, Ohba M, Ojeda C. The steady state TTX-sensitive (“window”) sodium current in cardiac Purkinje fibres. Pflugers Arch. 1979;379:137–142. - PubMed
    1. Jovanovic A, Alekseev AE, Lopez JR, Shen WK, Terzic A. Adenosine prevents hyperkalemia-induced calcium loading in cardiac cells: relevance for cardioplegia. Ann Thorac Surg. 1997;63:153–161. - PubMed
    1. Cohen NM, Wise RM, Wechsler AS, Damiano RJ., Jr Elective cardiac arrest with a hyperpolarizing adenosine triphosphate-sensitive potassium channel opener. A novel form of myocardial protection? J Thorac Cardiovasc Surg. 1993;106:317–328. - PubMed

Publication types