. 2009 Aug;12(8):1062-8.
doi: 10.1038/nn.2342. Epub 2009 Jul 20.

Prefrontal and striatal dopaminergic genes predict individual differences in exploration and exploitation

Affiliations

Prefrontal and striatal dopaminergic genes predict individual differences in exploration and exploitation

Michael J Frank et al. Nat Neurosci. 2009 Aug.

Erratum in

  • Nat Neurosci.2010 May;13(5):649

Abstract

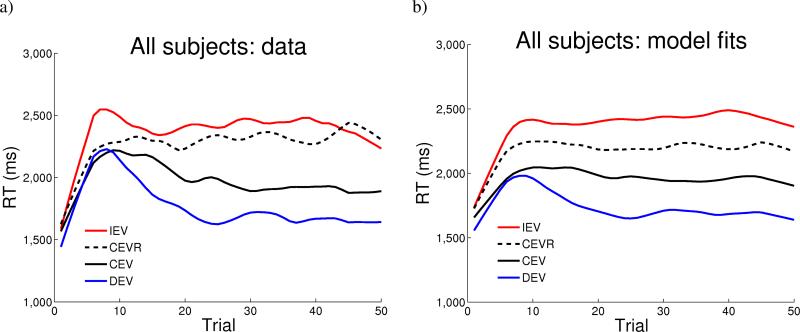
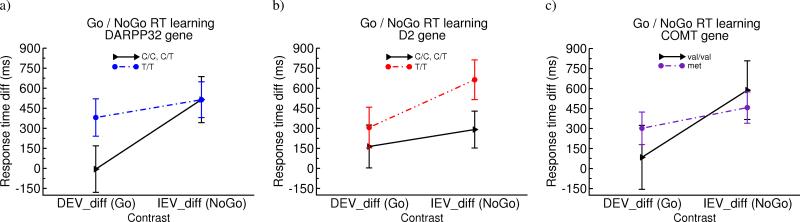
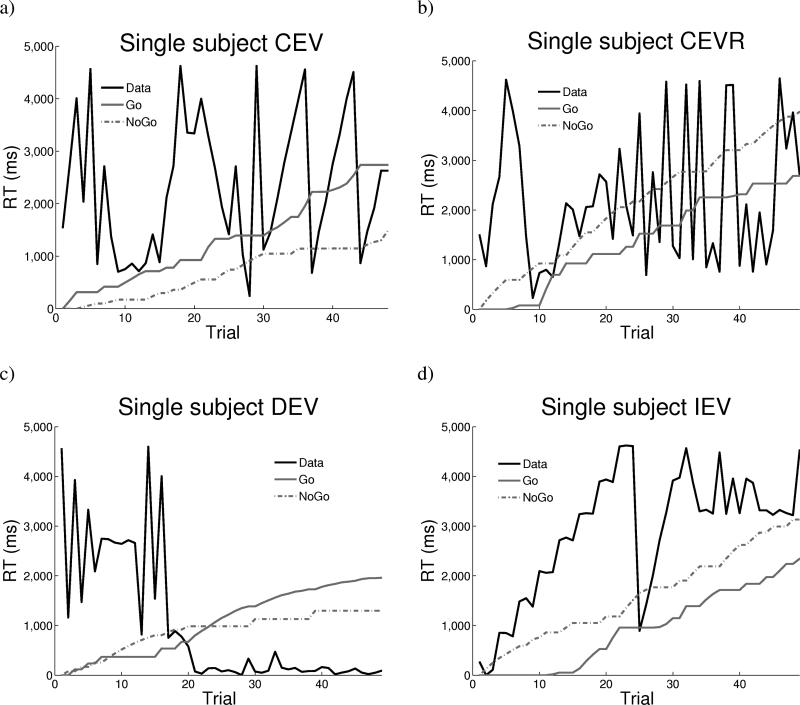
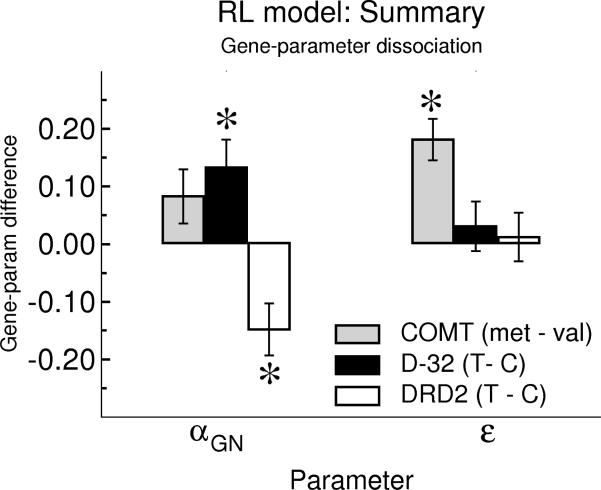
The basal ganglia support learning to exploit decisions that have yielded positive outcomes in the past. In contrast, limited evidence implicates the prefrontal cortex in the process of making strategic exploratory decisions when the magnitude of potential outcomes is unknown. Here we examine neurogenetic contributions to individual differences in these distinct aspects of motivated human behavior, using a temporal decision-making task and computational analysis. We show that two genes controlling striatal dopamine function, DARPP-32 (also called PPP1R1B) and DRD2, are associated with exploitative learning to adjust response times incrementally as a function of positive and negative decision outcomes. In contrast, a gene primarily controlling prefrontal dopamine function (COMT) is associated with a particular type of 'directed exploration', in which exploratory decisions are made in proportion to Bayesian uncertainty about whether other choices might produce outcomes that are better than the status quo. Quantitative model fits reveal that genetic factors modulate independent parameters of a reinforcement learning system.


Figures

Figure 1
Figure 1
Task conditions: decreasing expected value (DEV), constant expected value (CEV), increasing expected value (IEV), and constant expected value - reverse (CEVR). The x axis corresponds to the time after onset of the clock stimulus at which the response is made. The functions are designed such that the expected value at the beginning in DEV is equal to that at the end in IEV so that at optimal performance, subjects should obtain the same average reward in both IEV and DEV. Faster responses were accompanied by longer inter-trial intervals so that reward-rate is roughly equalized across conditions. a) Example clock-face stimulus. Each trial ended when the subject made a response or otherwise when the 5 s duration elapsed. The number of points won on the current trial was displayed. b) Probability of reward occurring as a function of response time; c) Reward magnitude (contingent on probability in b); d) Expected value across trials for each time point. Note that CEV and CEVR have the same EV.
Figure 2
Figure 2
Response times as a function of trial number, smoothed (with weighted linear least squares fit) over a 10 trial window, in a) all 69 participants, b) computational model.
Figure 3
Figure 3
Relative within-subjects biases to speed RTs in DEV relative to CEV (DEVdiff = CEV – DEV) and to slow RTs in IEV (IEVdiff IEV = IEV – CEV). Values represent mean (standard error) in the last quarter of trials in each condition. a) DARPP-32 gene, b) DRD2 gene, c) COMT gene.
Figure 4
Figure 4
Trial-to-trial RT adjustments in a single subject in a) CEV, b) CEVR, c) DEV, and d) IEV. Model Go and NoGo terms (magnified by 4x) accumulate as a function of positive and negative prediction errors. Go dominates over NoGo in DEV and the reverse in IEV, but these incremental changes do not capture trial-by-trial dynamics. For this subject, = 0.63 and = 0.74 (ms/point).
Figure 5
Figure 5
Genetic effects on reinforcement model parameters. DARPP-32 T/T carriers showed relatively greater learning rates from gains than losses (αGN = αG – αN) compared to C carriers. DRD2 T/T carriers showed the opposite pattern. The COMT gene did not affect learning rates, but met carriers had significantly higher uncertainty-based explore parameter (ε) values (which are divided by 104 to be displayed on the same scale) than did val/val participants. Error bars reflect standard error.
Figure 6
Figure 6
Evolution of action-value distributions. a), b) Beta probability density distributions representing the belief about the likelihood of reward prediction errors following fast and slow responses, averaged across all subjects’ data. The x axis is the probability of a positive prediction error and the y-axis represents the belief in each probability, with the mean value μ representing the best guess. Dotted lines reflect distributions after a single trial; dashed lines after 25 trials; solid lines, after 50 trials. (See supplemental animation #1 for dynamic changes in these distributions across all trials for a single subject). Differences between the μfast and μslow were used to adjust RTs to maximize reward likelihood. The standard deviation σ was taken as an index of uncertainty. Exploration was predicted to modulate RT in direction of greater uncertainty about whether outcomes might be better than the status quo. c), d) Trajectory of means and standard deviations for a single subject in DEV and IEV conditions. Uncertainties σ decrease with experience. Corresponding Beta hyperparameters η, β are shown in the supplement.
Figure 7
Figure 7
COMT gene predicts directed exploration toward uncertain responses. a) RT swings (change in RT from the previous trial) in a single met/met subject in the CEV condition, and the corresponding model uncertainty-based Explore term (amplified to be on the same RT scale). See supplemental animation #2 for this subject's evolution of beta distributions in CEV. b) COMT gene-dose effect on the uncertainty-based exploration parameter ε. Gene-dose effects were also observed when comparing relative contributions of ε compared with c) a reverse-momentum parameter γ, and d) a lose-switch parameter κ. Relative Z-scores are plotted here due to comparison of parameters scaling quantities of different magnitudes. Error bars reflect standard error.

Comment in

References

    1. Scheres A, Sanfey AG. Behavioral and brain functions. 2006;2:35. - PMC - PubMed
    1. Hsu M, Bhatt M, Adolphs R, Tranel D, Camerer CF. Science (New York, N. 2005;310:1680. - PubMed
    1. Frank MJ, Woroch BS, Curran T. Neuron. 2005;47:495. - PubMed
    1. Gittins JC, Jones D. Progress in Statistics. North Holland: 1974.
    1. Sutton RS, Barto AG. Reinforcement Learning: An Introduction. MIT Press; Cambridge, MA: 1998.

Publication types

MeSH terms

Substances