. 2009 Jul;7(7):e1000155.
doi: 10.1371/journal.pbio.1000155. Epub 2009 Jul 21.

CFTR delivery to 25% of surface epithelial cells restores normal rates of mucus transport to human cystic fibrosis airway epithelium

Affiliations

CFTR delivery to 25% of surface epithelial cells restores normal rates of mucus transport to human cystic fibrosis airway epithelium

Liqun Zhang et al. PLoS Biol. 2009 Jul.

Abstract

Dysfunction of CFTR in cystic fibrosis (CF) airway epithelium perturbs the normal regulation of ion transport, leading to a reduced volume of airway surface liquid (ASL), mucus dehydration, decreased mucus transport, and mucus plugging of the airways. CFTR is normally expressed in ciliated epithelial cells of the surface and submucosal gland ductal epithelium and submucosal gland acinar cells. Critical questions for the development of gene transfer strategies for CF airway disease are what airway regions require CFTR function and how many epithelial cells require CFTR expression to restore normal ASL volume regulation and mucus transport to CF airway epithelium? An in vitro model of human CF ciliated surface airway epithelium (CF HAE) was used to test whether a human parainfluenza virus (PIV) vector engineered to express CFTR (PIVCFTR) could deliver sufficient CFTR to CF HAE to restore mucus transport, thus correcting the CF phenotype. PIVCFTR delivered CFTR to >60% of airway surface epithelial cells and expressed CFTR protein in CF HAE approximately 100-fold over endogenous levels in non-CF HAE. This efficiency of CFTR delivery fully corrected the basic bioelectric defects of Cl(-) and Na(+) epithelial ion transport and restored ASL volume regulation and mucus transport to levels approaching those of non-CF HAE. To determine the numbers of CF HAE surface epithelial cells required to express CFTR for restoration of mucus transport to normal levels, different amounts of PIVCFTR were used to express CFTR in 3%-65% of the surface epithelial cells of CF HAE and correlated to increasing ASL volumes and mucus transport rates. These data demonstrate for the first time, to our knowledge, that restoration of normal mucus transport rates in CF HAE was achieved after CFTR delivery to 25% of surface epithelial cells. In vivo experimentation in appropriate models will be required to determine what level of mucus transport will afford clinical benefit to CF patients, but we predict that a future goal for corrective gene transfer to the CF human airways in vivo would attempt to target at least 25% of surface epithelial cells to achieve mucus transport rates comparable to those in non-CF airways.


Conflict of interest statement

The authors have declared that no competing interests exist.

Figures

Figure 1
Figure 1. Infection of human ciliated cells by PIV in vitro and ex vivo.
(A) Scanning electron micrograph of HAE showing cilia and mucus on the luminal surface. (B) Histological cross-section of HAE showing pseudostratified, columnar airway epithelium with ciliated (cc) and mucin-secreting cells (mc) and basal epithelial cells (bc). (C) Representative confocal XZ sections of HAE or (D) histological sections of human tracheobronchial tissue inoculated with PIVGFP (106 PFU) and GFP expression assessed at 24 h pi. GFP was detected by indirect immunofluorescence with rabbit anti-GFP polyclonal antibodies (Ab) and goat anti-rabbit IgG-fluorescein (green). Ciliated cells were identified using mouse primary Ab against acetylated α-tubulin and detected with anti-mouse IgG-Texas Red (red). GFP colocalized to cells that were also positive for acetylated α-tubulin, confirming the targeting of ciliated cells in vitro and ex vivo by PIV. Bar represents 20 µm in (A); and 5 µm in (B, C, and D).
Figure 2
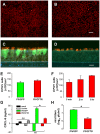
Figure 2. Efficient targeting of CF ciliated cells by PIVCFTR.
(A–D) Representative immunodetection of human PIV fusion (F) glycoprotein (red) (A and B) en face or (C and D) in histological sections of CF HAE 48 h pi with PIVGFP (A and C) or PIVCFTR (B and D). F glycoprotein was detected by indirect immunofluorescence with a murine monoclonal anti-F Ab and anti-mouse IgG conjugated to AlexaFluor 594 (red). GFP-positive cells were identified in histological sections (C), using rabbit anti-GFP conjugated to fluorescein (green). Fluorescence was viewed using a Texas Red filter only (A and B) or a combined Texas Red-FITC-UV-filter (C and D). Bars represent 200 µm and 10 µm for (A and B, and C and D), respectively. (E and F) Quantitation of (E) numbers of PIV F-positive ciliated cells showing that PIVGFP and PIVCFTR infect similar numbers of ciliated cells at 48 h pi (n = 8); and (F) the efficiency of ciliated cell infection by PIVCFTR assessed at 24 h was similar with 5-min, 2-h, or 8-h inoculation times (n = 6). (G) CXCL8 protein levels secreted by HAE 48 h pi with mock, UV-inactivated PIV, PIVGFP, or PIVCFTR showing reduced levels for PIVCFTR versus PIVGFP. Responses positive/negative of the abscissa reflect CXCL8 secretion into apical/basolateral compartments, respectively (n = 5 for each). (H) Viral titers in apical compartment at 48 h pi for PIVGFP (green) and PIVCFTR (red) showing attenuated growth of PIVCFTR (n = 5 for each). An asterisk (*) denotes p<0.05; ns, not significantly different. Error bars indicate SEM .
Figure 3
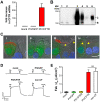
Figure 3. Expression of functional CFTR in CF ciliated cells targeted by PIV.
(A) CFTR mRNA levels in CF HAE 48 h after inoculation with PIVGFP or PIVCFTR and relative to mRNA levels in CF HAE mock-inoculated (n = 12). (B) Representative western blot of CFTR protein in lysates of CF HAE 48 h pi with mock (lane 1), PIVGFP (lane 2), and PIVCFTR (lanes 3–5), with lanes 4 and 5 representing serial 10-fold dilution of cell lysates. For comparison, non-CF HAE lysates also were included to detect endogenous CFTR levels (lane 6). Markers indicate the fully glycosylated mature form of CFTR (Band C) and immature nonglycosylated CFTR (Band B). Data are representative of experiments with cells derived from two separate patients. (C) Representative confocal images of CFTR immunoreactivity in CF HAE (i and ii), and non-CF HAE (iii and iv), 48 h after inoculation with PIVGFPCFTR (i and iii) or PIVGFP (ii and iv). CFTR was detected with CFTR monoclonal Ab (clone 596) and secondary Abs conjugated to AlexaFluor 594 (red). CF HAE inoculated with PIVGFPCFTR (i) showed immunolocalization of CFTR at apical domains of ciliated cells that were also GFP-positive, but not in GFP-negative ciliated cells or in CF HAE infected with PIVGFP (ii). Robust apical domain CFTR and GFP were detected in non-CF HAE ciliated cells inoculated with PIVGFPCFTR and endogenous CFTR levels detected in GFP-negative ciliated cells (iii, arrowheads). Endogenous CFTR was detected at the apical membranes of GFP-positive and -negative ciliated cells after inoculation with PIVGFP (iv, arrowheads). Bar represents 5 µm. (D) Representative traces of short-circuit current measurements (I sc) from CF HAE 48 h pi by PIVCFTR, PIVGFP, or mock showing post amiloride responses to sequentially added forskolin (Fsk), and CFTR172. A representative Fsk-induced I sc response by a non-CF HAE is shown for comparison. No Fsk responses were seen in CF HAE inoculated with PIVGFP or mock, consistent with the absence of CFTR. (E) Summary data for Fsk-activated changes in I scI sc) in CF HAE 48 h pi with mock, PIVGFP, PIVΔF508CFTR, or PIVCFTR. Fsk responses for non-CF HAE are shown as comparison. CFTR delivery to ciliated cells resulted in restoration of functional Cl channel activity in CF HAE to levels exhibited in non-CF HAE. Each bar represents at least 11 cultures from four different patients. ns denotes not significantly different. Error bars indicate SEM.
Figure 4
Figure 4. CFTR activity in ciliated cells is regulated by factors other than CFTR levels.
(A) Percentage inhibition of Fsk-activated CFTR by CFTR172 applied to either the apical (AP) or basolateral (BL) surfaces of PIVCFTR-corrected CF HAE. CFTR activity was inhibited by apical, but not basolateral, addition of CFTR172 for at least 15 min (n = 4). (B) Driving force for Cl secretion does not dictate magnitude of the Fsk response determined by measurement of Fsk-mediated ΔI sc under physiological Cl concentration (KBR) or Cl-free solutions (HKLC) in CF HAE 48 h after inoculation by PIVGFP (green bars) or PIVCFTR (red bars) and compared to non-CF HAE (white bars) (n = 8). (C) UTP-mediated Cl secretion in KBR (solid bars) and HKLC (hatched bars) bathing solutions after inoculation of CF HAE with vehicle alone (black bars), PIVGFP (green bars), or PIVCFTR (red bars) (n = 6). Note that under conditions of increased driving force for Cl secretion, responses far exceed the maximal responses achieved with Fsk-mediated CFTR activation in the presence of overexpressed CFTR. (D) Fsk-induced ΔI SC in non-CF HAE inoculated with mock (black bars), PIVGFP (green bars), or PIVCFTR (red bars), showing that overexpression of CFTR on top of endogenous CFTR does not significantly enhance the Fsk-mediated secretory response under physiological conditions (n = 5 for each). ns denotes not significantly different. Error bars indicate SEM .
Figure 5
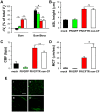
Figure 5. Expression of CFTR in CF ciliated cells restores normal ASL homeostasis and MCT to CF HAE.
(A) The contribution of Cl and Na+ to transepithelial electrical potential difference (Vt) under thin-film conditions in CF HAE mock-inoculated (black bars), PIVGFP (green bars), or PIVCFTR (red bars). Vt changes for non-CF HAE are shown for comparison (white bars). Bar graphs depict percentage change in Vt in response to Cl channel inhibitor bumetanide (Bum) and Na+ channel inhibitor benzamil (Bum/Benz). Each bar represents eight cultures derived from three different patients, and an asterisk (*) indicates p<0.05, and ns indicates not significant. (B) ASL height measurements 24 h after apical addition of 25 µl of PBS containing Texas Red dextran to CF HAE 48 h pi with mock (black), PIVGFP (green), or PIVCFTR (red) and compared to ASL height in non-CF HAE (white). Each bar represents nine cultures from three patients. (C) Cilia beat frequency measurements (CBF in beats per second [bps]) from CF HAE 24 h after the addition of 25 µl of PBS to CF HAE 48 h pi with mock (black), PIVGFP (green), or PIVCFTR (red) and compared to non-CF HAE (white). Each bar represents six cultures derived from two patients. (D) MCT rates measured 24 h after bead addition to CF HAE inoculated with mock (black), PIVGFP (green), or PIVCFTR (red). MCT for non-CF HAE are shown for comparison (white). Each bar represents at least nine cultures derived from three patients. (E) Representative photomicrographs showing time-lapse (3-s exposures) movement 24 h after addition of green fluorescent microspheres (as an index of MCT) on CF HAE 48 h after inoculation with mock (i), PIVGFP (ii), or PIVCFTR (iii). Note: GFP-positive cells are also observed below beads in PIVGFP-inoculated CF HAE. Bar represents 60 µm, and asterisk (*) denotes p<0.05, and ns not significantly different compared to non-CF HAE (iv). Error bars indicate SEM.
Figure 6
Figure 6. Duration of CFTR functional correction is limited by shedding of PIV-infected ciliated cells.
(A) Duration of CFTR functional activity in PIV corrected CF HAE. CF HAE were inoculated with PIVCFTR (red bars) or PIVGFP (green bars) at day 0, and ion transport studies were performed at days specified (n = 8 cultures derived from 3 different patients). Significant CFTR function could be measured for up to 8 d but waned by 21 d pi in CF HAE inoculated with PIVCFTR. No significant CFTR function was detected in CF HAE inoculated with PIVGFP. (B) Histological Cytospin assessment of cells shed into apical surface secretions at day 6 pi showing few shed ciliated cells in mock-inoculated CF HAE (i and iii), whereas significant numbers of cells were shed after PIVGFP (ii and iv). Cytospinned apical washes were counterstained with Giemsa (i and ii) or probed with Abs to GFP (green) and acetylated alpha-tubulin (red) to show ciliated cells. Bar represents 20 µm. Images are representative of Cytospins from two individual experiments. (C) Loss of PIV F-positive cells over time after inoculation with PIVCFTR (red bars) or PIVGFP (green bars), showing that PIVCFTR and PIVGFP infected equal numbers of ciliated cells at day 2, but that ciliated cell shedding was delayed for PIVCFTR versus PIVGFP by day 8. Data derived from same dataset in (A). An asterisk (*) denotes p<0.05. Error bars indicate SEM.
Figure 7
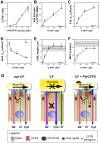
Figure 7. How many CF airway epithelial cells require CFTR to restore ASL homeostasis and MCT to non-CF HAE levels?
(A) Quantitation of the percentage of PIV F-positive cells 24 h after inoculation with different concentrations of PIVCFTR (103–106 PFU) and correlation of percentage of PIVCFTR-positive cells to: (B) increased CFTR mRNA expression levels; (C) Fsk-activated changes in I sc; (D) amil-induced changes in I sc; (E) ASL height; and (F) MCT rates. All measurements were made 24 h after inoculation with PIVCFTR (closed red circles) or controls (PIVGFP or PIVΔF508CFTR, closed green triangles) as described in Materials and Methods. n>11 for each data point representing cultures from 2 or 3 different donors. Dashed lines and grey shaded regions represent mean and standard deviations of ASL heights and MCT rates measured in parallel experiments with non-CF HAE. For these experiments, approximately 80% of surface cells were ciliated cells. (G) Schematic representation depicting the role of CFTR and ENaC in ASL homeostasis in non-CF airway epithelium; the presence of CFTR modulates ENaC activity and combined regulation of these ion channels dictates ASL depth regulation at a level sufficient for effective MCT (black arrow). In CF airway epithelium, the absence of CFTR reduces fluid secretion and leads to dysregulation of ENaC activity overall resulting in hyperabsorption of surface fluid, dehydration of ASL, and mucostasis with accumulation of mucus plugs. Delivery of CFTR to ciliated cells of CF HAE by PIV restores CFTR function, ENaC regulation, ASL homeostasis, and MCT. Error bars indicate SEM.

Comment in

References

    1. Koch C, Hoiby N. Pathogenesis of cystic fibrosis. Lancet. 1993;341:1065–1069. - PubMed
    1. Randell S. H, Boucher R. C. Effective mucus clearance is essential for respiratory health. Am J Respir Cell Mol Biol. 2006;35:20–28. - PMC - PubMed
    1. Kreda S. M, Mall M, Mengos A, Rochelle L, Yankaskas J, et al. Characterization of wild-type and deltaF508 cystic fibrosis transmembrane regulator in human respiratory epithelia. Mol Biol Cell. 2005;16:2154–2167. - PMC - PubMed
    1. Wu J. V, Krouse M. E, Wine J. J. Acinar origin of CFTR-dependent airway submucosal gland fluid secretion. Am J Physiol Lung Cell Mol Physiol. 2007;292:L304–311. - PubMed
    1. Jeffery P. Form and function of airway epithelium. In: Jones C. J, editor. Epithelia: advances in cell physiology and cell culture. London: Kluwer Academic Publishers; 1990. pp. 195–220.

Publication types

MeSH terms