. 2009 Jul;7(7):e1000157.
doi: 10.1371/journal.pbio.1000157. Epub 2009 Jul 21.

Development of large-scale functional brain networks in children

Affiliations

Development of large-scale functional brain networks in children

Kaustubh Supekar et al. PLoS Biol. 2009 Jul.

Abstract

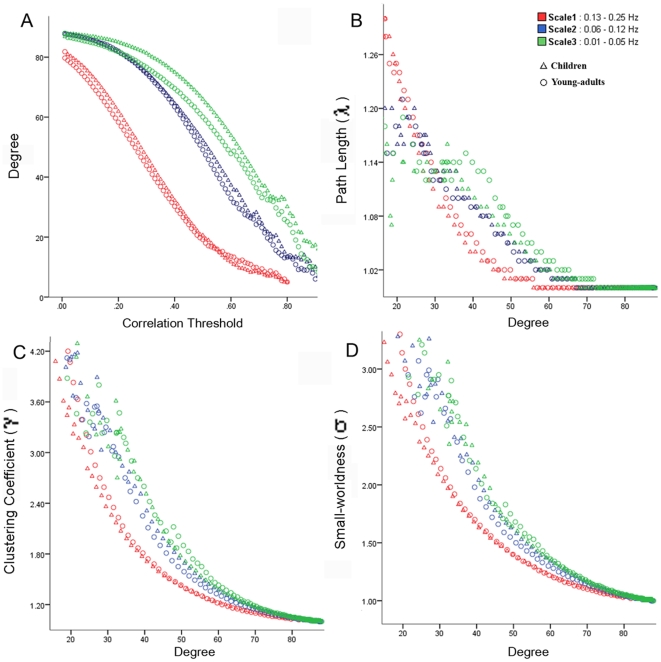
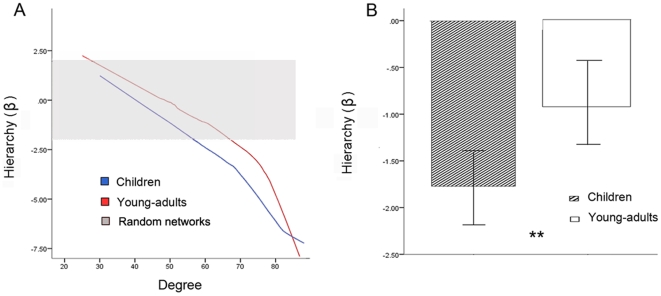
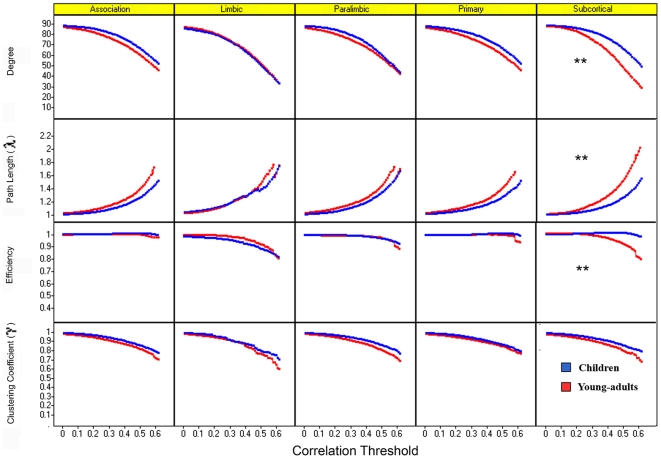
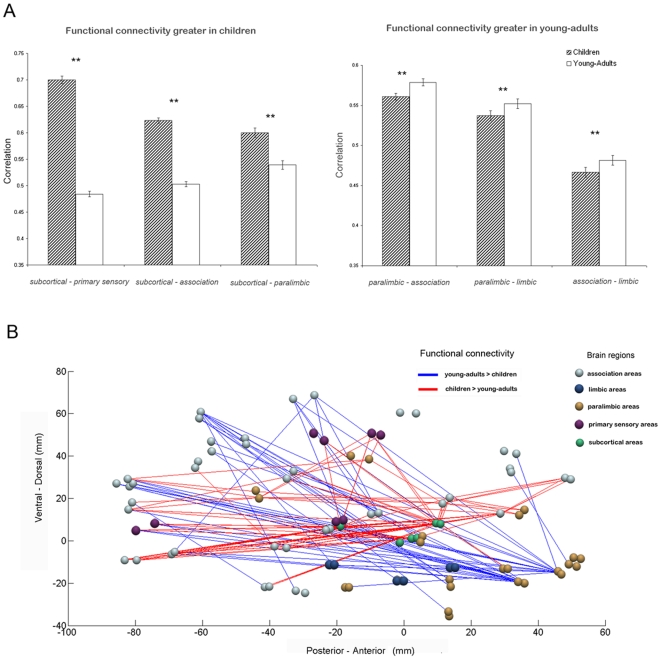
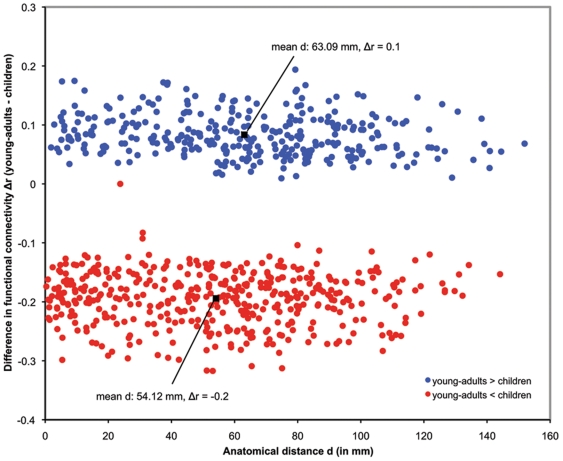
The ontogeny of large-scale functional organization of the human brain is not well understood. Here we use network analysis of intrinsic functional connectivity to characterize the organization of brain networks in 23 children (ages 7-9 y) and 22 young-adults (ages 19-22 y). Comparison of network properties, including path-length, clustering-coefficient, hierarchy, and regional connectivity, revealed that although children and young-adults' brains have similar "small-world" organization at the global level, they differ significantly in hierarchical organization and interregional connectivity. We found that subcortical areas were more strongly connected with primary sensory, association, and paralimbic areas in children, whereas young-adults showed stronger cortico-cortical connectivity between paralimbic, limbic, and association areas. Further, combined analysis of functional connectivity with wiring distance measures derived from white-matter fiber tracking revealed that the development of large-scale brain networks is characterized by weakening of short-range functional connectivity and strengthening of long-range functional connectivity. Importantly, our findings show that the dynamic process of over-connectivity followed by pruning, which rewires connectivity at the neuronal level, also operates at the systems level, helping to reconfigure and rebalance subcortical and paralimbic connectivity in the developing brain. Our study demonstrates the usefulness of network analysis of brain connectivity to elucidate key principles underlying functional brain maturation, paving the way for novel studies of disrupted brain connectivity in neurodevelopmental disorders such as autism.


Conflict of interest statement

The authors have declared that no competing interests exist.

Figures

Figure 1
Figure 1. Developmental changes in whole-brain functional connectivity network metrics.
Graph metrics: degree, path length (λ), clustering coefficient (γ), small-worldness (σ), for children (Δ) and young-adults (○) at three frequency intervals. (A) For both groups, the mean degree, a measure of network connectivity, is highest at scale 3 for a wide range of correlation thresholds (0.01<R<0.8). (B) The mean characteristic path length (λ) is low (1<λ<1.57) and shows similar trends at all the scales. (C) The clustering coefficient (γ) for both groups is highest at scale 3. (D) Due to higher mean γ values, the small-world measure σ (γ/λ) is highest at scale 3 for both groups. σ showed a linear increase in small-worldness as the threshold increased and the degree decreased. σ values for higher correlation thresholds are hard to interpret as at higher threshold values graphs of functional brain networks have fewer edges (smaller degree) and tend to split into isolated subgraphs. At each of the three scales, no significant differences in the degree, path length, clustering coefficient, and small-worldness values, for a range of correlation thresholds, were observed between children and young-adults. Scale 1 (0.13–0.25 Hz) is shown in red, scale 2 (0.06–0.12 Hz) is in blue, and scale 3 (0.01–0.05 Hz) is in green.
Figure 2
Figure 2. Developmental changes in hierarchical organization of whole-brain functional connectivity network.
(A) Hierarchy measure (β), for children (blue) and young-adults (red) at scale 3 (0.01– 0.05 Hz). The β values for both groups are high (β z-scores ranged from −7.5 to 2.5), and are significantly greater than the β values obtained from random networks (βrandom z-scores ranged from −1.96 to 1.96, indicated in gray). (B) Mean β values were significantly higher in young-adults (indicated by **) compared to children (p<0.01). Error bars represent standard error.
Figure 3
Figure 3. Developmental changes in network metrics for five major functional divisions of the human brain.
Graph metrics—degree, path length (λ), efficiency, clustering coefficient (γ), within each of the five divisions: association, limbic, paralimbic, primary, and subcortical—are shown for children (blue) and young-adults (red), as a function of the correlation threshold. In the subcortical division, for threshold values from 0.1 to 0.6, degree and efficiency values were significantly higher and λ values significantly lower in children, compared to young-adults (p<0.01, indicated by **), while for the association, limbic, paralimbic, and primary sensory areas, no significant differences in the degree, λ, efficiency, and γ values were observed at any correlation threshold.
Figure 4
Figure 4. Developmental changes in interregional functional connectivity.
(A) Children had significantly greater subcortical-primary sensory, subcortical-association, subcortical-paralimbic, and lower paralimbic-association, paralimbic-limbic, association-limbic connectivity than young-adults (p<0.01, indicated by **). Error bars represent standard error. (B) Graphical representation of developmental changes in functional connectivity along the posterior-anterior and ventral-dorsal axes, highlighting higher subcortical connectivity (subcortical nodes are shown in green) and lower paralimbic connectivity (paralimbic nodes are shown in gold) in children, compared to young-adults. Brain regions are plotted using the y and z coordinates of their centroids (in mm) in the MNI space. 430 pairs of anatomical regions showed significantly higher correlations in children and 321 pairs showed significantly higher correlations in young-adults (p<0.005, FDR corrected). For illustration purposes, the plot shows differential connectivity that were most significant, 105 pairs higher in children (indicated in red) and 53 higher in young-adults (indicated in blue), (p<0.0001, FDR corrected).
Figure 5
Figure 5. Developmental changes in functional connectivity with DTI-based wiring distance.
The wiring distance (d) of all connections which differed significantly between the children and young-adults is plotted against developmental change in functional correlation values (Δr) of those connections. Correlation values that were higher in children, compared to young-adults, are displayed in red, and the values that were higher in young-adults, compared to children, are displayed in blue. The mean wiring distance of the connections that showed higher correlation values in children (mean Δr = −0.2), compared to young-adults, was 54.12 mm; the mean wiring distance of the connections that showed higher correlation values in young-adults (mean Δr = 0.1), compared to children, was 63.09 mm. The correlation values of short-range connections were significantly greater in children whereas young-adults showed stronger long-range connectivity (p<0.0001). Wiring distances were computed using DTI-based fiber tracking.

Comment in

References

    1. Giedd J. N, Blumenthal J, Jeffries N. O, Castellanos F. X, Liu H, et al. Brain development during childhood and adolescence: a longitudinal MRI study. Nat Neurosci. 1999;2:861–863. - PubMed
    1. Good C. D, Johnsrude I. S, Ashburner J, Henson R. N, Friston K. J, et al. A voxel-based morphometric study of ageing in 465 normal adult human brains. NeuroImage. 2001;14:21–36. - PubMed
    1. Thompson P. M, Giedd J. N, Woods R. P, MacDonald D, Evans A. C, et al. Growth patterns in the developing brain detected by using continuum mechanical tensor maps. Nature. 2000;404:190–193. - PubMed
    1. Pujol J, Vendrell P, Junque C, Marti-Vilalta J. L, Capdevila A. When does human brain development end? Evidence of corpus callosum growth up to adulthood. Ann Neurol. 1993;34:71–75. - PubMed
    1. Sowell E. R, Thompson P. M, Leonard C. M, Welcome S. E, Kan E, et al. Longitudinal mapping of cortical thickness and brain growth in normal children. J Neurosci. 2004;24:8223–8231. - PMC - PubMed

Publication types