

Brain-type and liver-type fatty acid-binding proteins: new tumor markers for renal cancer?
- PMID: 19622156
- PMCID: PMC2732640
- DOI: 10.1186/1471-2407-9-248
Brain-type and liver-type fatty acid-binding proteins: new tumor markers for renal cancer?
Abstract
Background: Renal cell carcinoma (RCC) is the most common renal neoplasm. Cancer tissue is often characterized by altered energy regulation. Fatty acid-binding proteins (FABP) are involved in the intracellular transport of fatty acids (FA). We examined the level of brain-type (B) and liver-type (L) FABP mRNA and the protein expression profiles of both FABPs in renal cell carcinoma.
Methods: Paired tissue samples of cancerous and noncancerous kidney parts were investigated. Quantitative RT-PCR, immunohistochemistry and western blotting were used to determine B- and L-FABP in tumor and normal tissues. The tissue microarray (TMA) contained 272 clinico-pathologically characterized renal cell carcinomas of the clear cell, papillary and chromophobe subtype. SPSS 17.0 was used to apply crosstables (chi2-test), correlations and survival analyses.
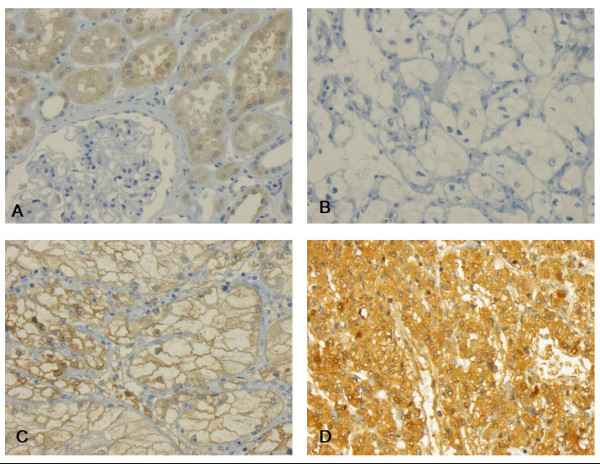
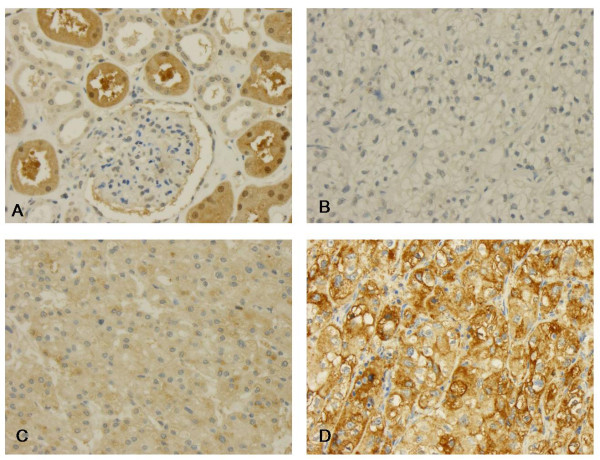
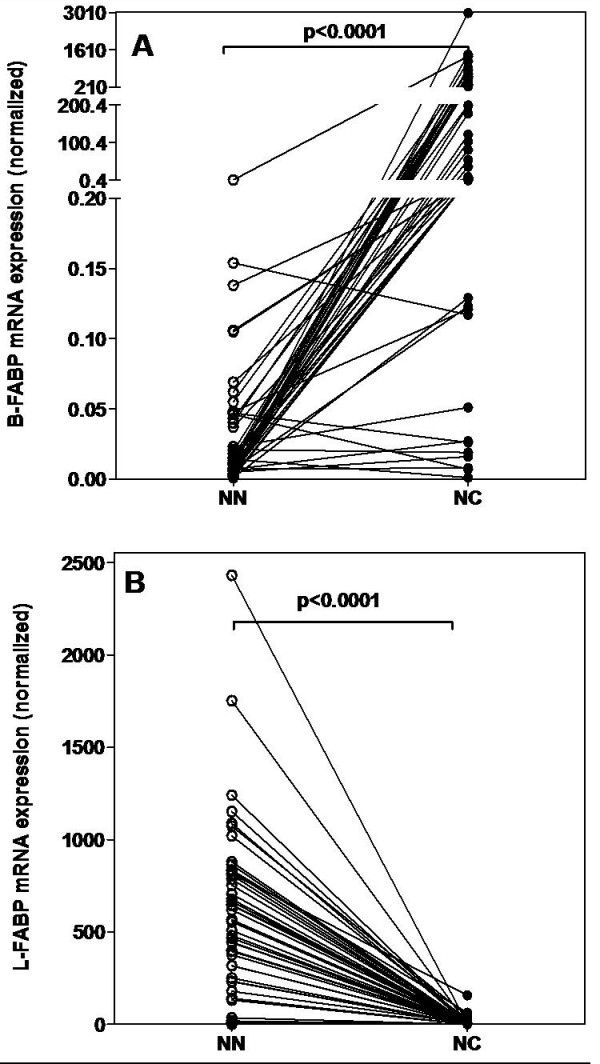
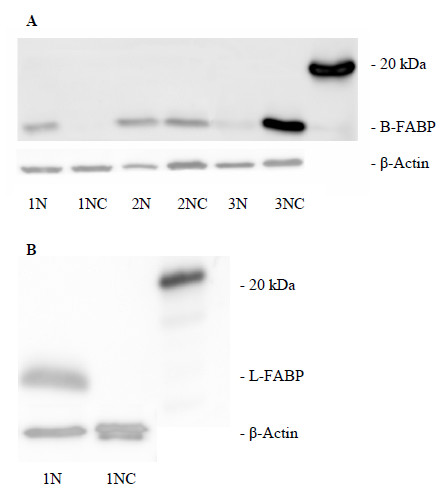
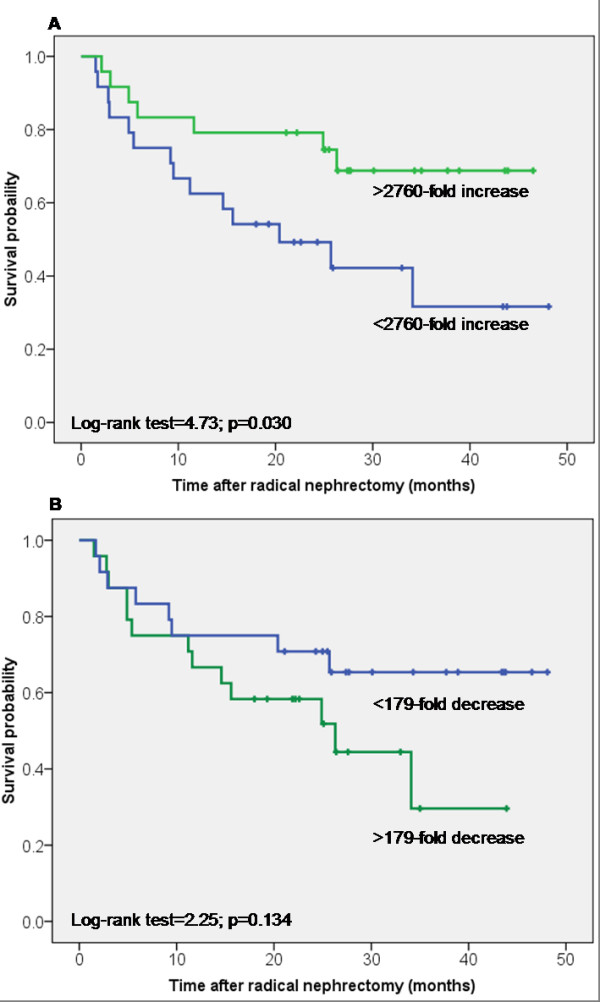
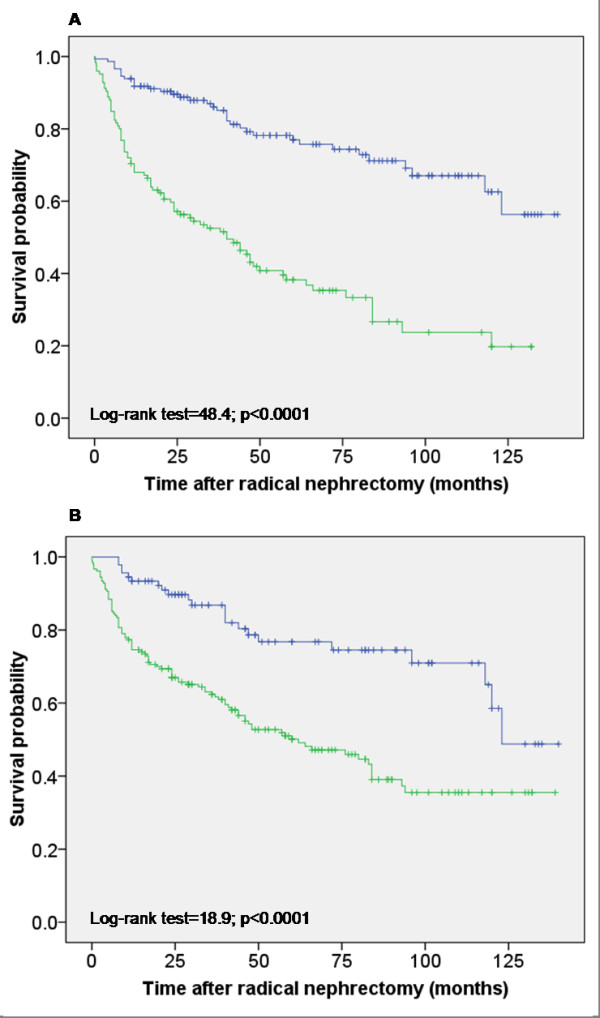
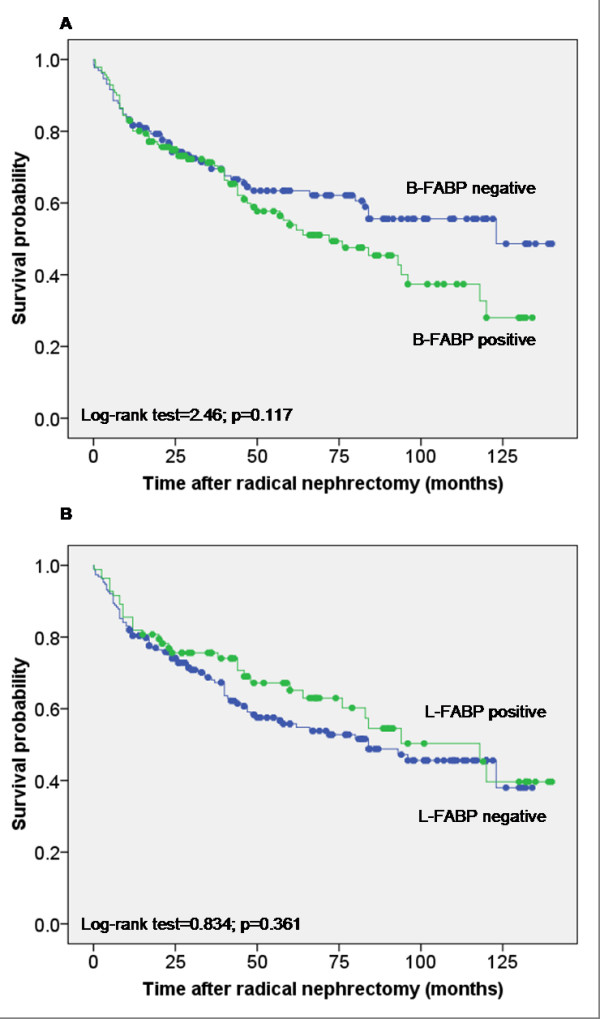
Results: B-FABP mRNA was significantly up-regulated in renal cell carcinoma. In normal tissue B-FABP mRNA was very low or often not detectable. RCC with a high tumor grading (G3 + G4) showed significantly lower B-FABP mRNA compared with those with a low grading (G1 + G2). Western blotting analysis detected B-FABP in 78% of the cases with a very strong band but in the corresponding normal tissue it was weak or not detectable. L-FABP showed an inverse relationship for mRNA quantification and western blotting. A strong B-FABP staining was present in 52% of the tumor tissues contained in the TMA. In normal renal tissue, L-FABP showed a moderate to strong immunoreactivity in proximal tubuli. L-FABP was expressed at lower rates compared with the normal tissues in 30.5% of all tumors. There was no correlation between patient survival times and the staining intensity of both FABPs.
Conclusion: While B-FABP is over expressed in renal cell carcinoma in comparison to normal renal tissues L-FABP appears to be reduced in tumor tissue. Although the expression behavior was not related to the survival outcome of the RCC patients, it can be assumed that these changes indicate fundamental alterations in the fatty metabolism in the RCC carcinogenesis. Further studies should identify the role of both FABPs in carcinogenesis, progression and with regard to a potential target in RCC.
Figures
Similar articles
-
Fatty acid binding proteins (FABPs) in prostate, bladder and kidney cancer cell lines and the use of IL-FABP as survival predictor in patients with renal cell carcinoma.BMC Cancer. 2011 Jul 18;11:302. doi: 10.1186/1471-2407-11-302. BMC Cancer. 2011. PMID: 21767383 Free PMC article.
-
Detection of transcript for brain-type fatty Acid-binding protein in tumor and urine of patients with renal cell carcinoma.Urology. 2007 Feb;69(2):236-40. doi: 10.1016/j.urology.2006.09.060. Urology. 2007. PMID: 17320655
-
Evaluation of S100A10, annexin II and B-FABP expression as markers for renal cell carcinoma.Cancer Sci. 2007 Jan;98(1):77-82. doi: 10.1111/j.1349-7006.2006.00355.x. Cancer Sci. 2007. PMID: 17083565 Free PMC article.
-
Role of fatty acid binding proteins (FABPs) in cancer development and progression.Cell Signal. 2019 Oct;62:109336. doi: 10.1016/j.cellsig.2019.06.001. Epub 2019 Jun 3. Cell Signal. 2019. PMID: 31170472 Review.
-
[The clinical significance of fatty acid binding proteins].Postepy Hig Med Dosw (Online). 2011 Nov 24;65:759-63. doi: 10.5604/17322693.966983. Postepy Hig Med Dosw (Online). 2011. PMID: 22173440 Review. Polish.
Cited by
-
Analysis of the regulation of fatty acid binding protein 7 expression in human renal carcinoma cell lines.BMC Mol Biol. 2011 Jul 19;12:31. doi: 10.1186/1471-2199-12-31. BMC Mol Biol. 2011. PMID: 21771320 Free PMC article.
-
Modulation of the Endocannabinoid System as a Potential Anticancer Strategy.Front Pharmacol. 2019 May 9;10:430. doi: 10.3389/fphar.2019.00430. eCollection 2019. Front Pharmacol. 2019. PMID: 31143113 Free PMC article. Review.
-
Fatty acid binding proteins (FABPs) in prostate, bladder and kidney cancer cell lines and the use of IL-FABP as survival predictor in patients with renal cell carcinoma.BMC Cancer. 2011 Jul 18;11:302. doi: 10.1186/1471-2407-11-302. BMC Cancer. 2011. PMID: 21767383 Free PMC article.
-
Fatty Acid-Binding Proteins in Psoriasis-A Review.Metabolites. 2022 Sep 3;12(9):833. doi: 10.3390/metabo12090833. Metabolites. 2022. PMID: 36144237 Free PMC article. Review.
-
Can Intestinal Fatty Acid Binding Protein (I-FABP) Be A Marker in the Diagnosis of Abdominal Pathology?Turk J Emerg Med. 2016 Feb 26;14(3):99-103. doi: 10.5505/1304.7361.2014.15679. eCollection 2014 Sep. Turk J Emerg Med. 2016. PMID: 27355087 Free PMC article.
References
-
- Gesellschaft der epidemiologischen Krebsregister in Deutschland. 6. Auflage, Robert Koch Institute, Berlin; 2008.
Publication types
MeSH terms
Substances
LinkOut - more resources
Full Text Sources
Medical
