. 2009 Nov;144(3):167-74.
doi: 10.1016/j.jbiotec.2009.07.010. Epub 2009 Jul 19.

Evaluation of 13C isotopic tracers for metabolic flux analysis in mammalian cells

Affiliations

Evaluation of 13C isotopic tracers for metabolic flux analysis in mammalian cells

Christian M Metallo et al. J Biotechnol. 2009 Nov.

Abstract

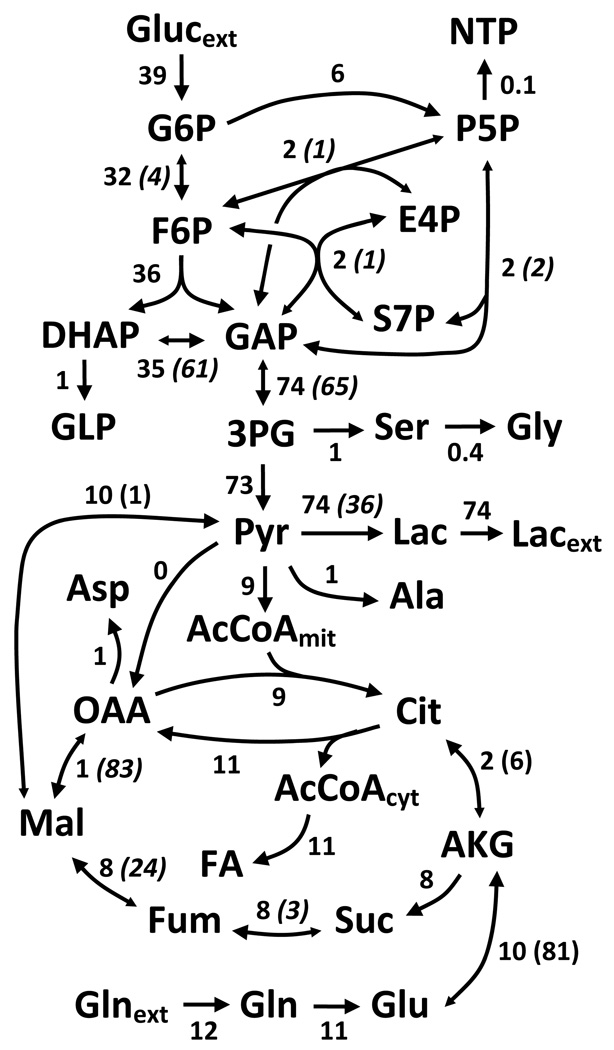
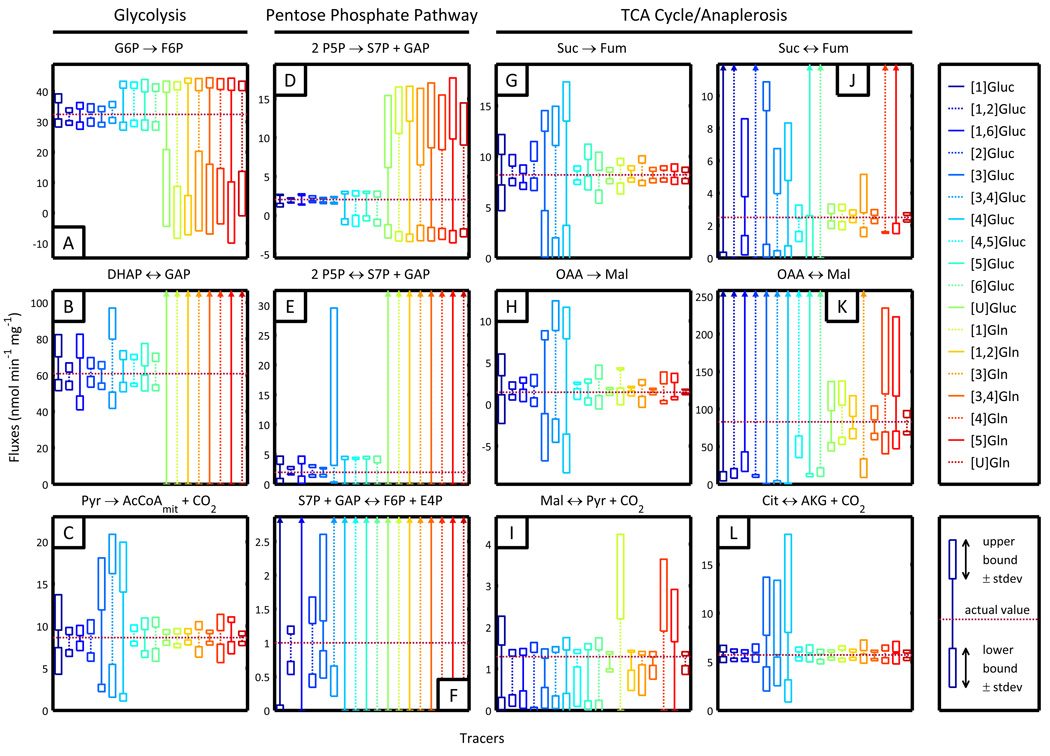
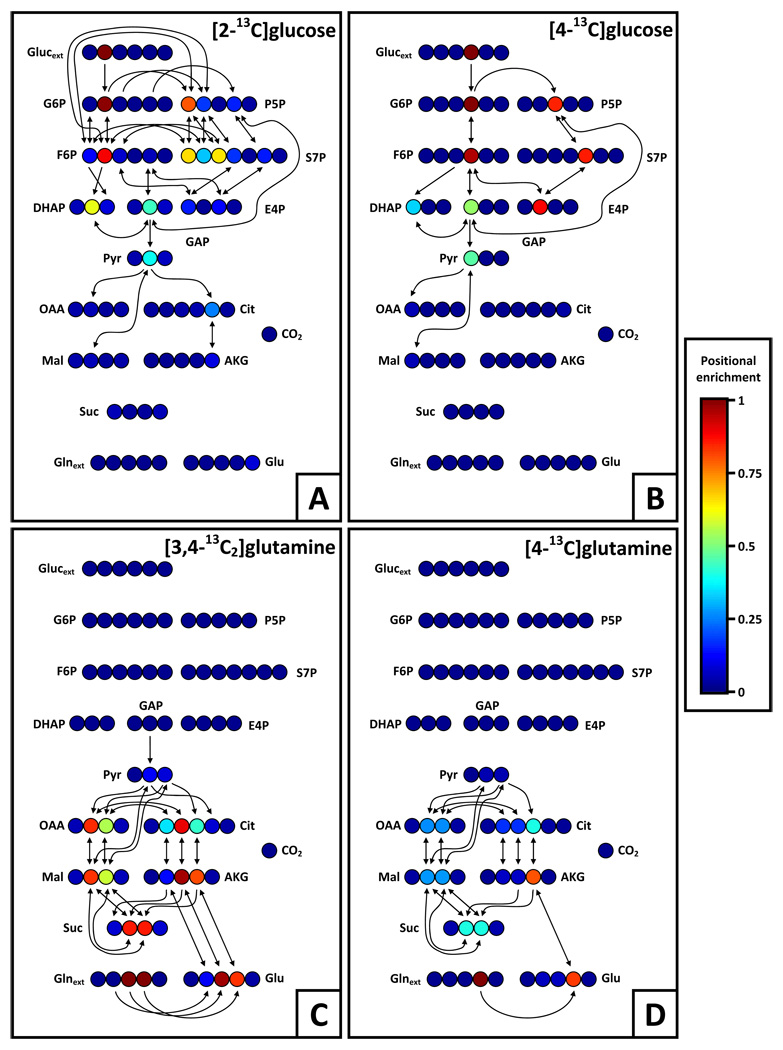
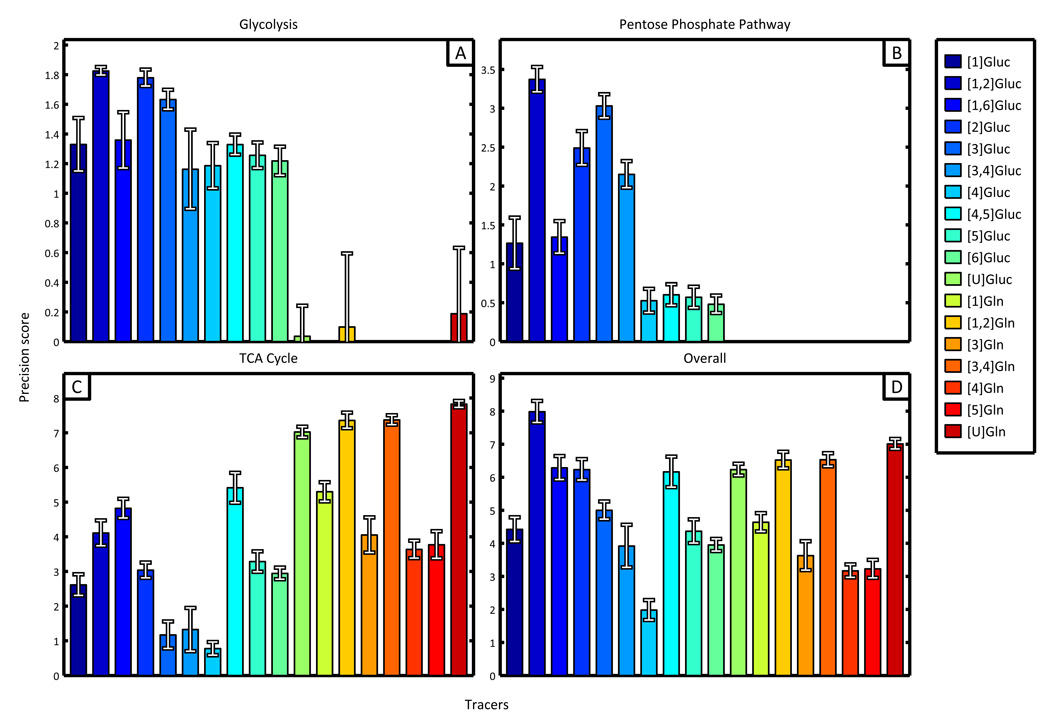
(13)C metabolic flux analysis (MFA) is the most comprehensive means of characterizing cellular metabolic states. Uniquely labeled isotopic tracers enable more focused analyses to probe specific reactions within the network. As a result, the choice of tracer largely determines the precision with which one can estimate metabolic fluxes, especially in complex mammalian systems that require multiple substrates. Here we have experimentally determined metabolic fluxes in a tumor cell line, successfully recapitulating the hallmarks of cancer cell metabolism. Using these data, we computationally evaluated specifically labeled (13)C glucose and glutamine tracers for their ability to precisely and accurately estimate fluxes in central carbon metabolism. These methods enabled us to identify the optimal tracer for analyzing individual fluxes, specific pathways, and central carbon metabolism as a whole. [1,2-(13)C(2)]glucose provided the most precise estimates for glycolysis, the pentose phosphate pathway, and the overall network. Tracers such as [2-(13)C]glucose and [3-(13)C]glucose also outperformed the more commonly used [1-(13)C]glucose. [U-(13)C(5)]glutamine emerged as the preferred isotopic tracer for the analysis of the tricarboxylic acid (TCA) cycle. These results provide valuable, quantitative information on the performance of (13)C-labeled substrates and can aid in the design of more informative MFA experiments in mammalian cell culture.


Figures

Figure 1
Figure 1
Experimentally determined fluxes representing central carbon metabolism in tumor cells. Extracellular fluxes and MIDs were measured and incorporated into the network shown (see Supplementary Table 2). An acceptable fit was obtained with a sum of squared residuals (SSR) of 52, well under the upper bound of the 95% confidence region for a χ2 distribution. Net fluxes are listed first for each reaction and exchange fluxes are within parenthesis. Units for all fluxes are nmol min−1 mg protein−1. Italicized numbers represent flux values that were taken from literature since they were unidentifiable for our particular experiment.
Figure 2
Figure 2
Simulated confidence intervals for selected fluxes when using specific isotopic tracers. Horizontal dashed lines indicate actual fluxes. Upper and lower bounds of the 95% confidence interval are illustrated for each simulated tracer. The standard error of both upper and lower bounds is represented by the boxes at the top and bottom of each interval. (A) Glucose-6-phosphate isomerase and (B) triose-phosphate isomerase fluxes demonstrate the effectiveness of glucose tracers in estimated glycolytic fluxes. (C) Pyruvate dehydrogenase flux is most precisely estimated by most glutamine tracers and some glucose tracers. (D–F) Net and exchange fluxes within the pentose phosphate pathway are best determined with glucose tracers labeled at the 1st, 2nd, or 3rd carbon, with [1,2]glucose performing best. (G,H) Net fluxes and (I–L) exchange fluxes in the TCA cycle are characterized well using [U]Gluc, [1,2]Gln, [3,4]Gln, or [U]Gln.
Figure 3
Figure 3
Atom transition networks and positional fractional labeling for selected glucose and glutamine tracers. Fractional labeling is indicated by a colormap, where dark red indicates all atoms at that position are 13C and dark blue that all atoms are 12C. No natural labeling was assumed in the creation of these maps. Atom transitions are indicated for all positions where fractional 13C labeling exceeds 10%. (A) [2]Gluc effectively characterizes glycolytic and PPP fluxes because DHAP (and by extension GLP) is labeled in multiple positions by different combinations of fluxes, leading to greater measurement sensitivity. (B) [4]Gluc poorly identifies fluxes in glycolysis and the PPP because its sole labeled carbon is caught in a cycle and can only reach the 1st carbon of DHAP. (C and D) [3,4]Gln and [4]Gln are both able to label a majority of the carbon atoms in the TCA cycle; however, the two labeled atoms in the former lead to larger, clearer measurements and therefore more precises fluxes.
Figure 4
Figure 4
Results obtained from precision scoring algorithm identify the optimal tracer for analysis of subnetworks and central carbon metabolism. The precision scores resulting from simulated experiments involving only natural labeling have been subtracted from each displayed tracer score to aid in visual differentiation and comparison. (A) Glycolysis and (B) pentose phosphate subnetworks are best described by [1,2]Gluc, [2]Gluc, and [3]Gluc. (C) TCA cycle scores were highest for [U]glucose and several glutamine tracers labeled at two or more carbons. (D) The most precise tracer for analysis of the entire network was [1,2]Gluc.

References

    1. Antoniewicz MR, Kelleher JK, Stephanopoulos G. Determination of confidence intervals of metabolic fluxes estimated from stable isotope measurements. Metab Eng. 2006;8:324–337. - PubMed
    1. Antoniewicz MR, Kelleher JK, Stephanopoulos G. Elementary metabolite units (EMU): a novel framework for modeling isotopic distributions. Metab Eng. 2007a;9:68–86. - PMC - PubMed
    1. Antoniewicz MR, Kraynie DF, Laffend LA, Gonzalez-Lergier J, Kelleher JK, Stephanopoulos G. Metabolic flux analysis in a nonstationary system: fed-batch fermentation of a high yielding strain of E. coli producing 1,3-propanediol. Metab Eng. 2007b;9:277–292. - PMC - PubMed
    1. Borner J, Buchinger S, Schomburg D. A high-throughput method for microbial metabolome analysis using gas chromatography/mass spectrometry. Anal Biochem. 2007;367:143–151. - PubMed
    1. Boros LG, Lerner MR, Morgan DL, Taylor SL, Smith BJ, Postier RG, Brackett DJ. [1,2-13C2]-D-glucose profiles of the serum, liver, pancreas, and DMBA-induced pancreatic tumors of rats. Pancreas. 2005;31:337–343. - PubMed

Publication types