Review
. 2010 Jan 27;314(2):170-83.
doi: 10.1016/j.mce.2009.07.010. Epub 2009 Jul 19.

Pineal function: impact of microarray analysis

Affiliations
Review

Pineal function: impact of microarray analysis

David C Klein et al. Mol Cell Endocrinol. .

Abstract

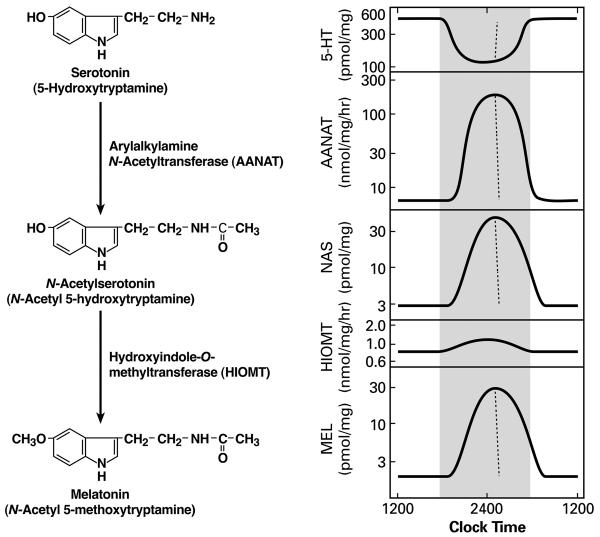
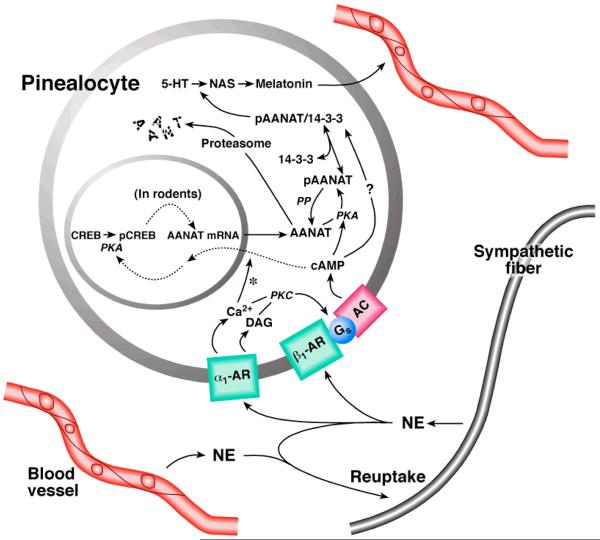
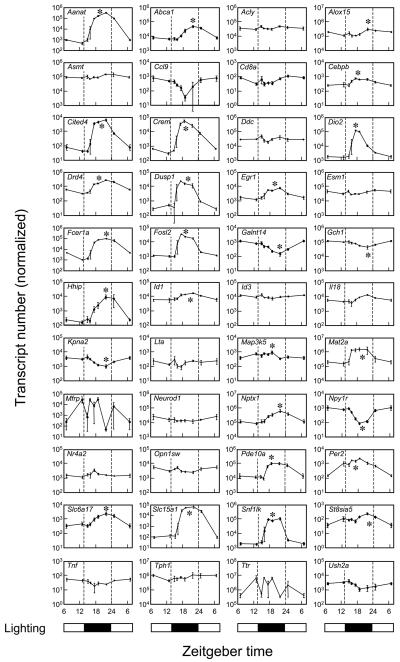
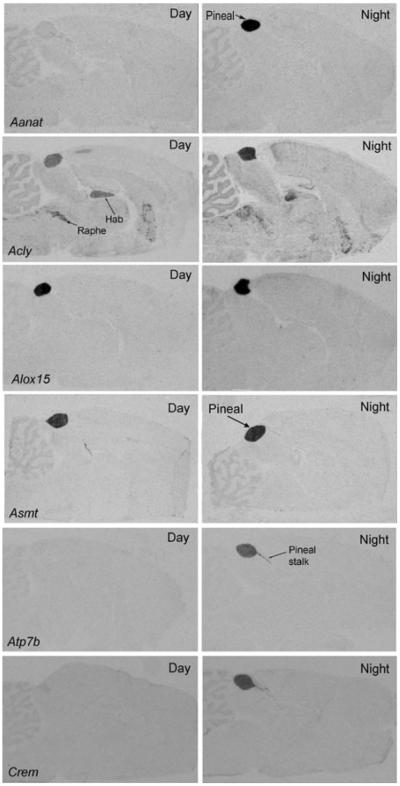
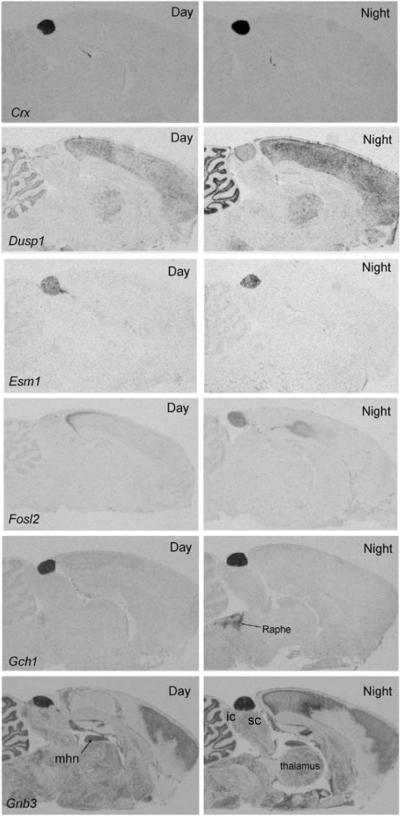
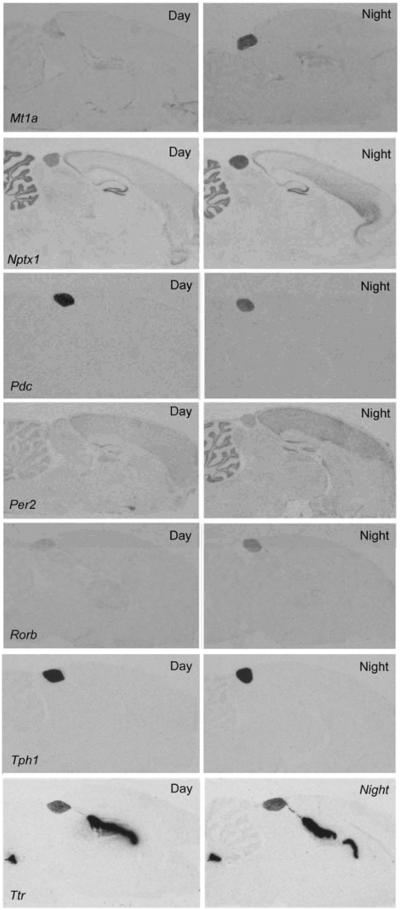
Microarray analysis has provided a new understanding of pineal function by identifying genes that are highly expressed in this tissue relative to other tissues and also by identifying over 600 genes that are expressed on a 24-h schedule. This effort has highlighted surprising similarity to the retina and has provided reason to explore new avenues of study including intracellular signaling, signal transduction, transcriptional cascades, thyroid/retinoic acid hormone signaling, metal biology, RNA splicing, and the role the pineal gland plays in the immune/inflammation response. The new foundation that microarray analysis has provided will broadly support future research on pineal function.


Figures

Figure 1
Figure 1
Daily rhythm in the serotonin to melatonin pathway. The chemical pathway is shown on the left and the dynamic changes in each element are shown on the right. This general pattern applies to all vertebrates; however the pattern seen in each species differs in amplitude and the shapes of the curves. The broken line represents the changes that are seen following exposure to light in the middle of the dark period. Modified after (Klein, 1974)
Figure 2
Figure 2
The mammalian melatonin rhythm generating system. The circadian clock which controls the daily rhythm in melatonin production in mammals is in the suprachiasmatic nucleus of the hypothalamus (SCN), located immediately above the optic chiasm (OC). SCN neurons project to the paraventricular nucleus (PVN), making synaptic contact with neurons of the PVN that project caudally close to the midline via the mesencephalic periaqueductal gray (PAG) to make synaptic contact with the intermediolateral nuclei (IML) in the upper thoracic segments of the spinal cord. There, preganglionic neurons innervate a small subpopulation of cells in the superior cervical ganglia (SCG) that send projections to the pineal gland (P) via the internal carotid nerve (ICN) and the conarian nerves (CN). At night, stimulatory signals from the SCN cause release of NE from the postganglionic nerves structures terminating in the pineal gland. In darkness at night, signals from the SCN flow to the pineal gland. Stimulation of the pineal gland by the SCN gradually decreases during the course of the night. In constant darkness these rhythms persist, but will have periods that are greater or less than 24 h. Light controls the period of the rhythm by acting through the retina and a retinohypothalamic projection (RHP), a subpopulation of axons in the optic nerves, to entrain the circadian clock in the SCN to the environmental lighting cycle. Light also controls output from the SCN to the pineal gland so that exposure to light at night terminates SCN stimulation of the pineal gland, resulting in the changes depicted by broken lines in Figure 1. Constant lighting also prevents the changes shown here (Klein, 1985).
Figure 3
Figure 3
Control of Aanat in the rodent pineal gland. At night, NE is released from sympathetic nerves in the perivascular space in the pineal gland. NE interacts with adrenergic receptors on the pinealocyte membrane to increase intracellular levels of cyclic AMP. This results in activation of cyclic AMP dependent protein kinase (PKC) and phosphorylation of cyclic AMP response element binding protein (CREB), thereby promoting transcription of Aanat. PKA also phosphorylates the Aanat protein, which increases the affinity of the protein for 14-3-3 proteins. The phosphorylated Aaant (pAanat)/ 14-3-3 regulatory complex, protects the pAanat against dephosphorylation by protein phosphatase (PP) and destruction by proteosomal proteolysis; in addition, pAanat has higher affinity for serotonin ( 5-hydroxytryptamine, 5-HT) when complexed to 14-3-3. The complex exists in a dynamic equilibrium with pAANAT and 14-3-3; complex in which formation is favored by phosphorylation. Complex formation increases N-acetylation of 5-HT resulting in an increase in N-acetylserotonin (NAS), which in turn enhances melatonin (MEL) production by a mass action effect, as shown in Figure 1. The levels of hydroxyindole-O-methyltransferase (Asmt) HIOMT do not change significantly on a daily basis. Melatonin is not stored and rapidly passes through the membrane into the circulation. During the day, melatonin production is limited by low levels of Aanat activity. During the night, melatonin synthesis is limited by a availability of cofactors, the activity of other enzymes required for melatonin production, and availability of tryptophan. Termination of the release of NE rapidly reverses the activated system because NE dissociates from receptors and any NE in the perivascular space is rapidly taken back up into the nerve terminals. The drop in perivascular NE causes an immediate reduction to basal levels of cyclic AMP and PKA, leading to disassembly of the Aanat regulatory complex, dephosphorylation of pAANAT and proteosomal proteolysis of Aanat, thereby rapidly decreasing melatonin production and release. The decrease in melatonin release causes a decrease in circulating melatonin because melatonin in the circulation is rapidly destroyed in the liver. The reuptake function of the nerves explains why nonspecific stress or injection of NE have little influence on melatonin production (Klein, 2007).
Figure 4
Figure 4
qRT-PCR analysis of transcripts that are night/day differentially expressed or have high rEx values or both. The lighting cycle is represented at the bottom of each column. Transcripts are identified by gene symbol. Each value is the mean ± S.E. of three determinations. Values were normalized to Actb, Gapdh, Hrpt1, and Rnr1. A single asterisk identifies statistically significant rhythmic patterns of gene expression (p< 0.01) based on log transformed raw values analyzed by one-way analysis of variance. From (Bailey et al., 2009) , which contains technical details.
Figure 5
Figure 5. Radiochemical in situ hybridization histology images
Each panel contains autoradiographs prepared from sections of rat brains through the pineal gland. The sections on the left are from animals killed during the day and those on the right are from animals killed during the night. The sections were incubated with antisense probes identified in the bottom left-hand corner of the Day image. c Hab, habenula; ic, inferior colliculus; mhn, medial habenular nucleus; Raphe, dorsal raphe nucleus; sc, superior colliculus. These figures are available in high resolution at http://science.nichd.nih.gov/confluence/display/sne/Daily+Changes+Gallery Taken from (Bailey et al., 2009), which contains technical details..

Similar articles

Cited by

References

    1. AITKEN A. 14-3-3 proteins: a historic overview. Semin Cancer Biol. 2006;16:162–72. - PubMed
    1. ALON S, EISENBERG E, JACOB-HIRSCH J, RECHAVI G, VATINE G, TOYAMA R, COON SL, KLEIN DC, GOTHILF Y. A new cis-acting regulatory element driving gene expression in the zebrafish pineal gland. Bioinformatics. 2009;25:559–62. - PMC - PubMed
    1. AUERBACH DA, KLEIN DC, KIRK KL, CANTACUZENE D, CREVELING CR. Effects on fluorine analogs of norepinephrine on stimulation of cyclic adenosine 3',5'-monophosphate and binding to beta-adrenergic receptors in intact pinealocytes. Biochem Pharmacol. 1981a;30:1085–9. - PubMed
    1. AUERBACH DA, KLEIN DC, WOODARD C, AURBACH GD. Neonatal rat pinealocytes: typical and atypical characteristics of [125I]iodohydroxybenzylpindolol binding and adenosine 3',5'-monophosphate accumulation. Endocrinology. 1981b;108:559–67. - PubMed
    1. AUERBACH G, HERRMANN A, BRACHER A, BADER G, GUTLICH M, FISCHER M, NEUKAMM M, GARRIDO-FRANCO M, RICHARDSON J, NAR H, HUBER R, BACHER A. Zinc plays a key role in human and bacterial GTP cyclohydrolase I. Proc Natl Acad Sci U S A. 2000;97:13567–72. - PMC - PubMed

Publication types

LinkOut - more resources