

Leptin-mediated changes in hepatic mitochondrial metabolism, structure, and protein levels
- PMID: 19622746
- PMCID: PMC2713753
- DOI: 10.1073/pnas.0903723106
Leptin-mediated changes in hepatic mitochondrial metabolism, structure, and protein levels
Abstract
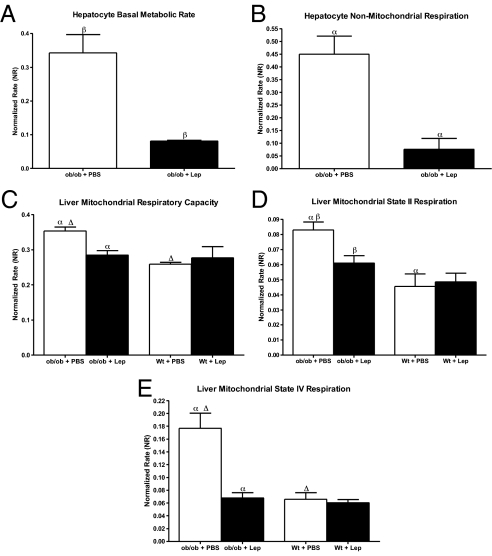
Leptin reduces body weight in ob/ob mice by decreasing food intake and increasing energy expenditure; however, the mechanisms by which it does the latter are not known. Here we report that 30% of the weight loss induced by leptin treatment of ob/ob mice is due to changes in energy expenditure. In assessing leptin's effects on specific tissues, we found that hepatic basal metabolic rate was paradoxically decreased 1.7-fold with leptin treatment, which was the result of a 1.6-fold reduction in mitochondrial volume density and altered substrate oxidation kinetics. The altered kinetics were associated with a decrease in protein levels of 2 mitochondrial respiratory chain components--cytochrome c oxidase subunit VIa and cytochrome c oxidase subunit IV. In addition to reduced hepatic metabolism, there was reduced long chain fatty acid production and a 2.5-fold increase in hepatic lipid export, both of which explain the reduced steatosis in leptin-treated animals. These data help clarify the role of the liver in leptin-mediated weight loss and define the mechanisms by which leptin alters hepatic metabolism and corrects steatosis.
Conflict of interest statement
The authors declare no conflict of interest.
Figures


Similar articles
-
Methionine restriction prevents the progression of hepatic steatosis in leptin-deficient obese mice.Metabolism. 2013 Nov;62(11):1651-61. doi: 10.1016/j.metabol.2013.06.012. Epub 2013 Aug 5. Metabolism. 2013. PMID: 23928105
-
Enhancing liver mitochondrial fatty acid oxidation capacity in obese mice improves insulin sensitivity independently of hepatic steatosis.J Hepatol. 2012 Mar;56(3):632-9. doi: 10.1016/j.jhep.2011.10.008. Epub 2011 Oct 25. J Hepatol. 2012. PMID: 22037024
-
Effect of leptin treatment on mitochondrial function in obese leptin-deficient ob/ob mice.Metabolism. 2013 Sep;62(9):1258-67. doi: 10.1016/j.metabol.2013.04.001. Epub 2013 May 8. Metabolism. 2013. PMID: 23664724
-
Stearoyl-CoA desaturase-1 and the metabolic syndrome.Curr Drug Targets Immune Endocr Metabol Disord. 2003 Dec;3(4):271-80. doi: 10.2174/1568008033340117. Curr Drug Targets Immune Endocr Metabol Disord. 2003. PMID: 14683458 Review.
-
Drug-induced toxicity on mitochondria and lipid metabolism: mechanistic diversity and deleterious consequences for the liver.J Hepatol. 2011 Apr;54(4):773-94. doi: 10.1016/j.jhep.2010.11.006. Epub 2010 Nov 17. J Hepatol. 2011. PMID: 21145849 Review.
Cited by
-
Dysregulation of mitochondrial dynamics mediated aortic perivascular adipose tissue-associated vascular reactivity impairment under excessive fructose intake.Nutr Metab (Lond). 2024 Jan 2;21(1):4. doi: 10.1186/s12986-023-00776-7. Nutr Metab (Lond). 2024. PMID: 38167066 Free PMC article.
-
Leptin as a Key between Obesity and Cardiovascular Disease.J Obes Metab Syndr. 2020 Dec 30;29(4):248-259. doi: 10.7570/jomes20120. J Obes Metab Syndr. 2020. PMID: 33342767 Free PMC article. Review.
-
Adenosine monophosphate-activated protein kinase activation mediates the leptin-induced attenuation of cognitive impairment in a streptozotocin-induced rat model.Exp Ther Med. 2015 May;9(5):1998-2002. doi: 10.3892/etm.2015.2317. Epub 2015 Feb 25. Exp Ther Med. 2015. PMID: 26136928 Free PMC article.
-
Leptin, Acting at Central Level, Increases FGF21 Expression in White Adipose Tissue via PPARβ/δ.Int J Mol Sci. 2021 Apr 28;22(9):4624. doi: 10.3390/ijms22094624. Int J Mol Sci. 2021. PMID: 33924880 Free PMC article.
-
Inflammatory mediators of hepatic steatosis.Mediators Inflamm. 2010;2010:837419. doi: 10.1155/2010/837419. Epub 2010 Mar 16. Mediators Inflamm. 2010. PMID: 20300479 Free PMC article. Review.
References
-
- Friedman J. Modern science vs the stigma of obesity. Nat Med. 2004;10:563–569. - PubMed
-
- Bouchard C, et al. The response to long-term overfeeding in identical twins. N Engl J Med. 1990;322:1477–1482. - PubMed
-
- Ravussin E. Metabolic differences and the development of obesity. Metabolism. 1995;44:12–14. - PubMed
-
- Levine JA, Eberhardt NL, Jensen MD. Role of nonexercise activity thermogenesis in resistance to fat gain in humans. Science. 1999;283:212–214. - PubMed
-
- Ravussin E, et al. Reduced rate of energy expenditure as a risk factor for body-weight gain. N Eng J Med. 1988;318:467–472. - PubMed
Publication types
MeSH terms
Substances
Grants and funding
LinkOut - more resources
Full Text Sources
Other Literature Sources
Molecular Biology Databases
Miscellaneous
