. 2009 Aug;65(Pt 8):758-66.
doi: 10.1107/S0907444909014711. Epub 2009 Jul 10.

A description of the structural determination procedures of a gap junction channel at 3.5 A resolution

Affiliations

A description of the structural determination procedures of a gap junction channel at 3.5 A resolution

Michihiro Suga et al. Acta Crystallogr D Biol Crystallogr. 2009 Aug.

Abstract

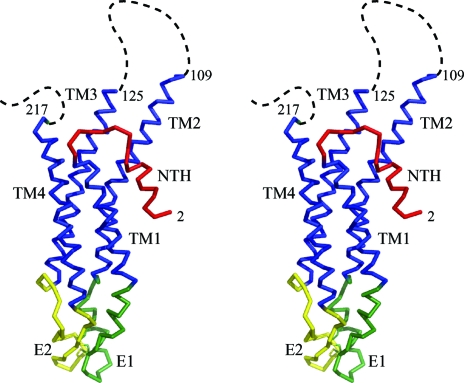
Intercellular signalling is an essential characteristic of multicellular organisms. Gap junctions, which consist of arrays of intercellular channels, permit the exchange of ions and small molecules between adjacent cells. Here, the structural determination of a gap junction channel composed of connexin 26 (Cx26) at 3.5 A resolution is described. During each step of the purification process, the protein was examined using electron microscopy and/or dynamic light scattering. Dehydration of the crystals improved the resolution limits. Phase refinement using multi-crystal averaging in conjunction with noncrystallographic symmetry averaging based on strictly determined noncrystallographic symmetry operators resulted in an electron-density map for model building. The amino-acid sequence of a protomer structure consisting of the amino-terminal helix, four transmembrane helices and two extracellular loops was assigned to the electron-density map. The amino-acid assignment was confirmed using six selenomethionine (SeMet) sites in the difference Fourier map of the SeMet derivative and three intramolecular disulfide bonds in the anomalous difference Fourier map of the native crystal.


Figures

Figure 1
Figure 1
Electron-microscopic images of the gap junction channels. (a) An electron-microscopic image of the membrane fraction obtained following alkaline treatment of the cells. (b) An electron-microscopic image of the gap junction channel solubilized with DDM. (c) An electron-microscopic image of the gap junction channel solubilized with octyl-β-d-glucoside. The samples were aggregated.
Figure 2
Figure 2
Stereo diagram of the self-rotation function for twofold rotational symmetry (κ = 180° section) calculated at 6.0 Å resolution. The maximum value was normalized to 100 and contours were drawn at intervals of 10 starting from 10.
Figure 3
Figure 3
Plots of R factor and correlation coefficients versus ω of NCSA phase extension. The NCSA phase extension was performed from 5 to 3.5 Å at each ω of the sixfold axis. The phase extension was carried out in 100 steps and NCSA was iterated by 20 cycles at each resolution. The initial phases for each NCSA were the phases obtained by the phase extension of the SIRAS phases from 15 Å resolution. The best R factor and correlation coefficient were obtained at ω = 31.1°.
Figure 4
Figure 4
Stereoscopic drawing of the difference Fourier map of the SeMet derivative calculated at 4.0 Å resolution. The map is contoured at 4.0σ. All of the selenium sites, except for the N-terminal SeMet, identified in high-electron-density peaks were associated with a residue number. Peaks without a residue number result from Se atoms in other protomers.
Figure 5
Figure 5
DM map calculated with the phases refined by multi-crystal averaging using DMMULTI. The electron-density map was calculated at 3.5 Å resolution and contoured at 0.7σ.
Figure 6
Figure 6
DM maps of the same region of the structure calculated with (a) refined phases from a single data set for native I using DM and (b) refined phases from two data sets from native I and native II using DMMULTI. Both maps are calculated at 3.5 Å resolution and contoured at 1.5σ. The latter showed an improved electron-density distribution for the helical structure.
Figure 7
Figure 7
A stereoscopic Cα drawing of the Cx26 protomer. The short N-terminal helix (NTH) is shown in red, the transmembrane (TM) regions are shown in blue (TM1, TM2, TM3 and TM4) and the two extracellular loops are shown in green and yellow (E1 and E2). Dashed lines represent disordered regions.
Figure 8
Figure 8
A stereoscopic Cα drawing of the Cx26 gap junction channel. The two hemichannels are related by a crystallographic twofold axis along the horizontal axis. The two protomers related by the twofold axis are depicted in the same colour.
Figure 9
Figure 9
A stereoscopic drawing of the native anomalous difference map calculated at 4.0 Å resolution and drawn at 8.0σ. The peaks correspond to the three intraprotomer disulfide bonds that bridge the two extracellular loops; the two extracellular loops are shown in green and yellow (E1 and E2).

References

    1. Bricogne, G., Vonrhein, C., Flensburg, C., Schiltz, M. & Paciorek, W. (2003). Acta Cryst. D59, 2023–2030. - PubMed
    1. Brünger, A. T., Adams, P. D., Clore, G. M., DeLano, W. L., Gros, P., Grosse-Kunstleve, R. W., Jiang, J.-S., Kuszewski, J., Nilges, M., Pannu, N. S., Read, R. J., Rice, L. M., Simonson, T. & Warren, G. L. (1998). Acta Cryst. D54, 905–921. - PubMed
    1. Collaborative Computational Project, Number 4 (1994). Acta Cryst. D50, 760–763. - PubMed
    1. DeLano, W. L. (2002). The PyMOL Molecular Graphics System. DeLano Scientific, Palo Alto, California, USA.
    1. Emsley, P. & Cowtan, K. (2004). Acta Cryst. D60, 2126–2132. - PubMed

Publication types

MeSH terms