

The excitotoxin quinolinic acid induces tau phosphorylation in human neurons
- PMID: 19623258
- PMCID: PMC2709912
- DOI: 10.1371/journal.pone.0006344
The excitotoxin quinolinic acid induces tau phosphorylation in human neurons
Expression of concern in
-
Expression of Concern: The Excitotoxin Quinolinic Acid Induces Tau Phosphorylation in Human Neurons.PLoS One. 2024 Nov 14;19(11):e0314139. doi: 10.1371/journal.pone.0314139. eCollection 2024. PLoS One. 2024. PMID: 39541324 Free PMC article. No abstract available.
Abstract
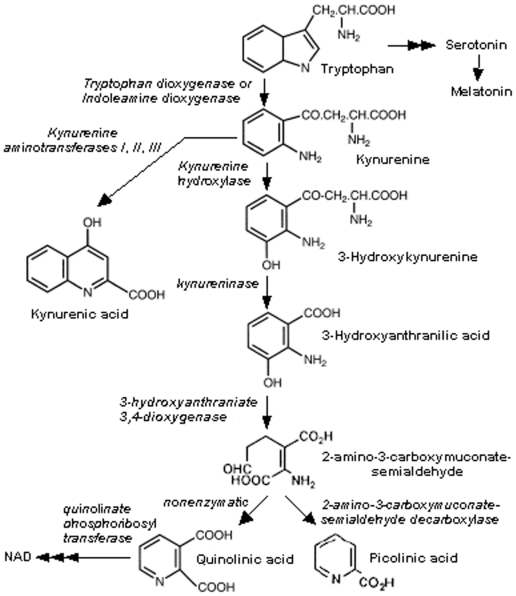
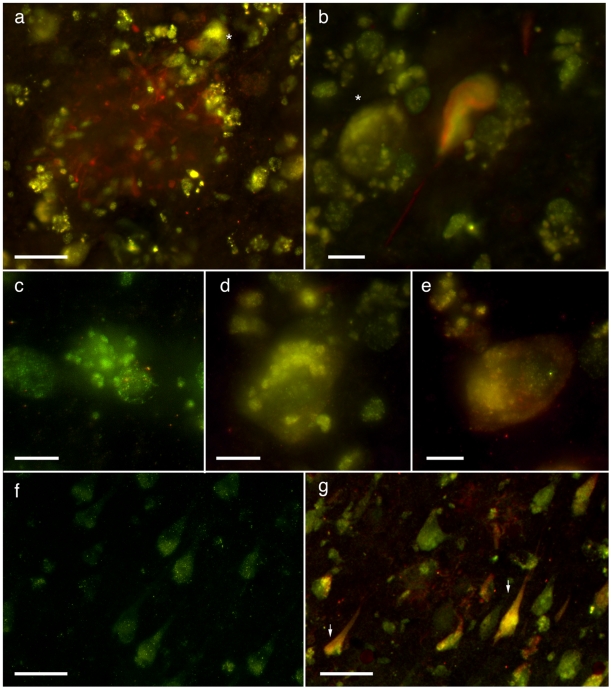
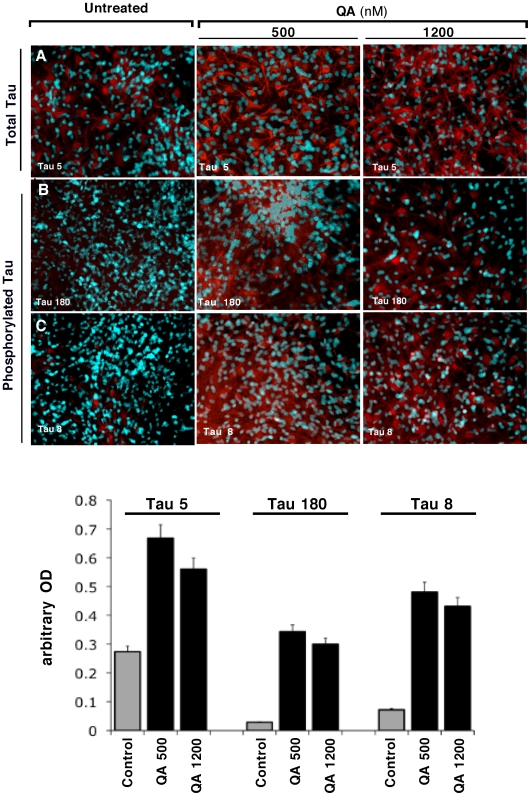
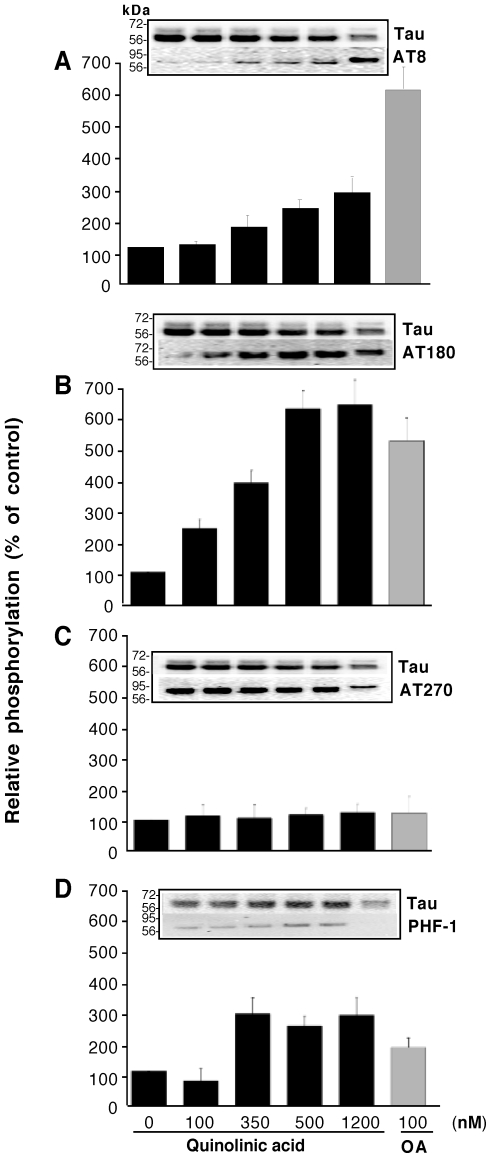
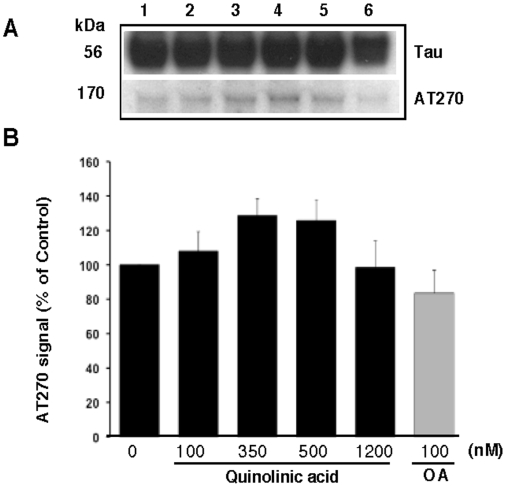
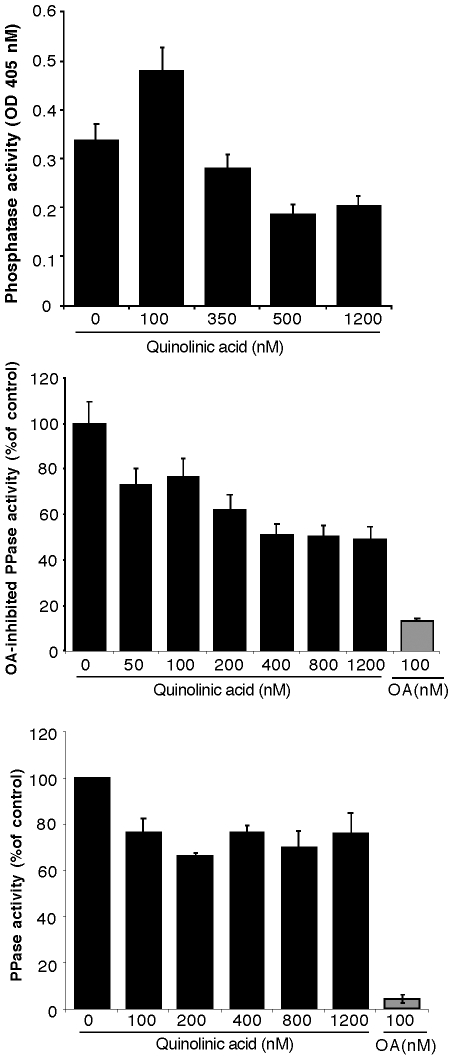
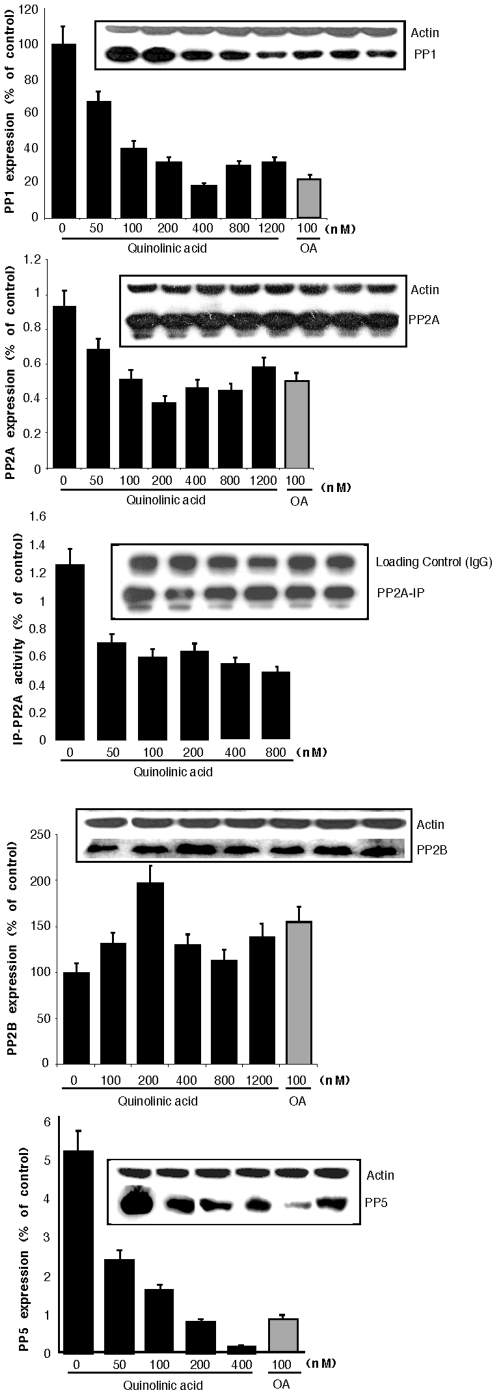
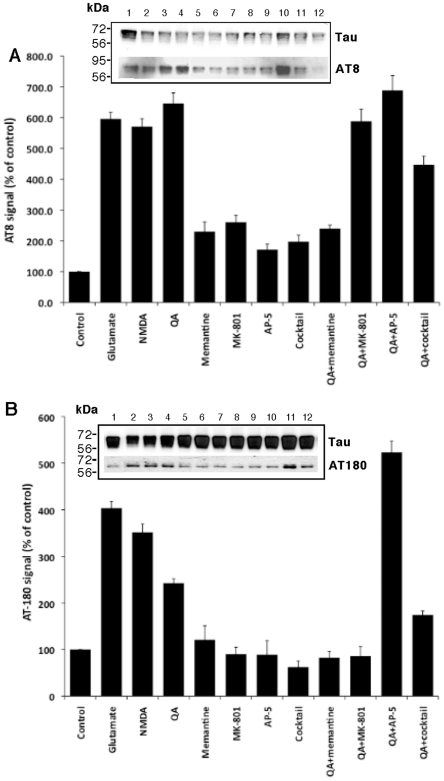
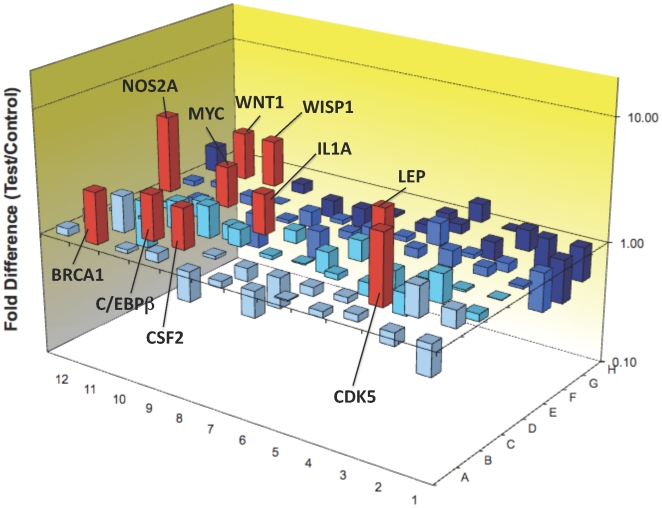
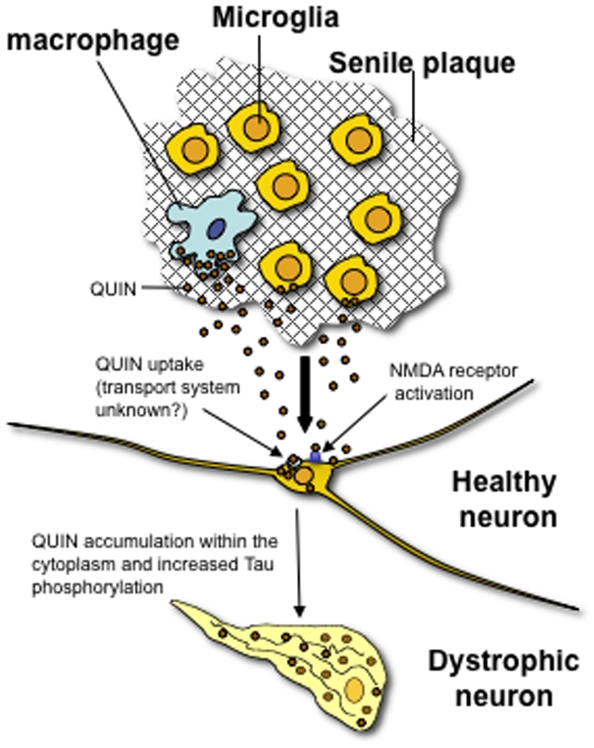
Some of the tryptophan catabolites produced through the kynurenine pathway (KP), and more particularly the excitotoxin quinolinic acid (QA), are likely to play a role in the pathogenesis of Alzheimer's disease (AD). We have previously shown that the KP is over activated in AD brain and that QA accumulates in amyloid plaques and within dystrophic neurons. We hypothesized that QA in pathophysiological concentrations affects tau phosphorylation. Using immunohistochemistry, we found that QA is co-localized with hyperphosphorylated tau (HPT) within cortical neurons in AD brain. We then investigated in vitro the effects of QA at various pathophysiological concentrations on tau phosphorylation in primary cultures of human neurons. Using western blot, we found that QA treatment increased the phosphorylation of tau at serine 199/202, threonine 231 and serine 396/404 in a dose dependent manner. Increased accumulation of phosphorylated tau was also confirmed by immunocytochemistry. This increase in tau phosphorylation was paralleled by a substantial decrease in the total protein phosphatase activity. A substantial decrease in PP2A expression and modest decrease in PP1 expression were observed in neuronal cultures treated with QA. These data clearly demonstrate that QA can induce tau phosphorylation at residues present in the PHF in the AD brain. To induce tau phosphorylation, QA appears to act through NMDA receptor activation similar to other agonists, glutamate and NMDA. The QA effect was abrogated by the NMDA receptor antagonist memantine. Using PCR arrays, we found that QA significantly induces 10 genes in human neurons all known to be associated with AD pathology. Of these 10 genes, 6 belong to pathways involved in tau phosphorylation and 4 of them in neuroprotection. Altogether these results indicate a likely role of QA in the AD pathology through promotion of tau phosphorylation. Understanding the mechanism of the neurotoxic effects of QA is essential in developing novel therapeutic strategies for AD.
Conflict of interest statement
Figures
Comment in
-
Editorial Note: The excitotoxin quinolinic acid induces tau phosphorylation in human neurons.PLoS One. 2025 May 8;20(5):e0323774. doi: 10.1371/journal.pone.0323774. eCollection 2025. PLoS One. 2025. PMID: 40338827 Free PMC article. No abstract available.
Similar articles
-
Up-regulation of phosphorylated/activated p70 S6 kinase and its relationship to neurofibrillary pathology in Alzheimer's disease.Am J Pathol. 2003 Aug;163(2):591-607. doi: 10.1016/S0002-9440(10)63687-5. Am J Pathol. 2003. PMID: 12875979 Free PMC article.
-
Pyridine-2,3-dicarboxylate, quinolinic acid, induces 1N4R Tau amyloid aggregation in vitro: Another evidence for the detrimental effect of the inescapable endogenous neurotoxin.Chem Biol Interact. 2020 Jan 5;315:108884. doi: 10.1016/j.cbi.2019.108884. Epub 2019 Oct 31. Chem Biol Interact. 2020. PMID: 31678113
-
Methotrexate decreases PP2A methylation and increases tau phosphorylation in neuron.Biochem Biophys Res Commun. 2007 Nov 23;363(3):811-6. doi: 10.1016/j.bbrc.2007.09.060. Epub 2007 Sep 24. Biochem Biophys Res Commun. 2007. PMID: 17904102
-
Kynurenine Pathway Metabolites as Biomarkers in Alzheimer's Disease.Dis Markers. 2022 Jan 19;2022:9484217. doi: 10.1155/2022/9484217. eCollection 2022. Dis Markers. 2022. PMID: 35096208 Free PMC article. Review.
-
How it all started: tau and protein phosphatase 2A.J Alzheimers Dis. 2013;37(3):483-94. doi: 10.3233/JAD-130503. J Alzheimers Dis. 2013. PMID: 23948891 Review.
Cited by
-
Effects of Exhaustive Aerobic Exercise on Tryptophan-Kynurenine Metabolism in Trained Athletes.PLoS One. 2016 Apr 28;11(4):e0153617. doi: 10.1371/journal.pone.0153617. eCollection 2016. PLoS One. 2016. PMID: 27124720 Free PMC article.
-
Expression of the Kynurenine Pathway in Human Peripheral Blood Mononuclear Cells: Implications for Inflammatory and Neurodegenerative Disease.PLoS One. 2015 Jun 26;10(6):e0131389. doi: 10.1371/journal.pone.0131389. eCollection 2015. PLoS One. 2015. PMID: 26114426 Free PMC article.
-
Kynurenines in the mammalian brain: when physiology meets pathology.Nat Rev Neurosci. 2012 Jul;13(7):465-77. doi: 10.1038/nrn3257. Nat Rev Neurosci. 2012. PMID: 22678511 Free PMC article. Review.
-
HIV, prospective memory, and cerebrospinal fluid concentrations of quinolinic acid and phosphorylated Tau.J Neuroimmunol. 2018 Jun 15;319:13-18. doi: 10.1016/j.jneuroim.2018.03.007. Epub 2018 Mar 18. J Neuroimmunol. 2018. PMID: 29685284 Free PMC article.
-
Expression of Concern: The Excitotoxin Quinolinic Acid Induces Tau Phosphorylation in Human Neurons.PLoS One. 2024 Nov 14;19(11):e0314139. doi: 10.1371/journal.pone.0314139. eCollection 2024. PLoS One. 2024. PMID: 39541324 Free PMC article. No abstract available.
References
-
- Stone TW. Neuropharmacology of quinolinic and kynurenic acids. Pharmacol Rev. 1993;45:309–379. - PubMed
-
- Stone TW, Perkins MN. Quinolinic acid: a potent endogenous excitant at amino acid receptors in CNS. Eur J Pharmacol. 1981;72:411–412. - PubMed
-
- Schwarcz R, Whetsell WO, Jr, Mangano RM. Quinolinic acid: an endogenous metabolite that produces axon-sparing lesions in rat brain. Science. 1983;219:316–318. - PubMed
-
- Guillemin GJ, Kerr SJ, Brew BJ. Involvement of quinolinic acid in AIDS dementia complex. Neurotox Res. 2005;7:103–123. - PubMed
-
- Heyes MP, Saito K, Crowley JS, Davis LE, Demitrack MA, et al. Quinolinic acid and kynurenine pathway metabolism in inflammatory and non-inflammatory neurological disease. Brain . 1992;115(Pt 5):1249–1273. - PubMed
Publication types
MeSH terms
Substances
LinkOut - more resources
Full Text Sources
Other Literature Sources
Molecular Biology Databases
