. 2009 Nov;14(8):1265-74.
doi: 10.1007/s00775-009-0571-z. Epub 2009 Jul 22.

Catalysis of iron core formation in Pyrococcus furiosus ferritin

Affiliations

Catalysis of iron core formation in Pyrococcus furiosus ferritin

Kourosh Honarmand Ebrahimi et al. J Biol Inorg Chem. 2009 Nov.

Abstract

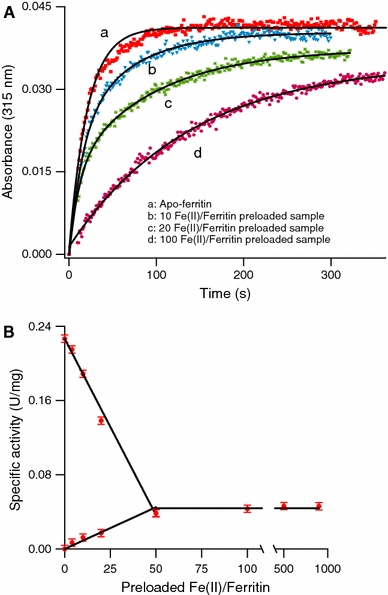
The hollow sphere-shaped 24-meric ferritin can store large amounts of iron as a ferrihydrite-like mineral core. In all subunits of homomeric ferritins and in catalytically active subunits of heteromeric ferritins a diiron binding site is found that is commonly addressed as the ferroxidase center (FC). The FC is involved in the catalytic Fe(II) oxidation by the protein; however, structural differences among different ferritins may be linked to different mechanisms of iron oxidation. Non-heme ferritins are generally believed to operate by the so-called substrate FC model in which the FC cycles by filling with Fe(II), oxidizing the iron, and donating labile Fe(III)-O-Fe(III) units to the cavity. In contrast, the heme-containing bacterial ferritin from Escherichia coli has been proposed to carry a stable FC that indirectly catalyzes Fe(II) oxidation by electron transfer from a core that oxidizes Fe(II). Here, we put forth yet another mechanism for the non-heme archaeal 24-meric ferritin from Pyrococcus furiosus in which a stable iron-containing FC acts as a catalytic center for the oxidation of Fe(II), which is subsequently transferred to a core that is not involved in Fe(II)-oxidation catalysis. The proposal is based on optical spectroscopy and steady-state kinetic measurements of iron oxidation and dioxygen consumption by apoferritin and by ferritin preloaded with different amounts of iron. Oxidation of the first 48 Fe(II) added to apoferritin is spectrally and kinetically different from subsequent iron oxidation and this is interpreted to reflect FC building followed by FC-catalyzed core formation.


Figures

Fig. 1
Fig. 1
The ferroxidase center of Pyrococcus furiosus ferritin including a third iron site, site C. Site C is located inside the protein shell. The figure was prepared with PyMOL and ChemDraw using coordinates from iron-soaked crystals [Protein Data Bank (PDB) entry 2jd7] [8]
Fig. 2
Fig. 2
Determination of the molar extinction coefficient at 315 nm for P. furiosus ferritin as a function of iron loading. a Low-iron plot: Fe2+ to ferritin ratio in the range 0–50. The protein concentration was 1.65 μM. b High-iron plot: Fe2+ to ferritin ratio in the range 0–2,000. The protein concentration was 0.105 μM
Fig. 3
Fig. 3
Specific activity of P. furiosus apoferritin as a function of initial Fe2+ concentration. The protein concentration was 0.296 μM
Fig. 4
Fig. 4
Comparison of the specific iron-oxidation activity of P. furiosus apoferritin with that of aerobically Fe2+-preloaded ferritin. The initial substrate concentration in all cases was 48 Fe2+ per ferritin. a Progress curves for apoferritin, a ten Fe2+ per ferritin preloaded sample, a 20 Fe2+ per ferritin preloaded sample, and a 100 Fe2+ per ferritin preloaded sample at 315 nm. The solid lines represent single-exponential or double-exponential fits. b Deconvolution into two processes of the specific activity versus the amount of Fe2+ that was preloaded aerobically to apoferritin: a process with high specific activity that decreases from apoferritin to 48 Fe2+ per ferritin preloaded sample and a process with low specific activity that develops from zero to a maximum for 48 Fe2+ per ferritin preloaded sample and that remains constant for preloaded samples with Fe2+ to ferritin ratios higher than 48. The protein concentration was 0.33 μM
Fig. 5
Fig. 5
Wavelength dependence of progress curves for iron oxidation by P. furiosus ferritin. Progress curves of apoferritin at a 315 nm and b 408 nm. Fe2+ was added in three consecutive steps, 48 Fe2+ per ferritin in each step. The protein concentration was 3.3 μM
Fig. 6
Fig. 6
Oxygen consumption by iron-oxidizing ferritin from P. furiosus. Aliquots of 5 μl of an anaerobic solution of ferrous sulfate were added in six consecutive steps, 48 Fe2+ per ferritin in each step. The protein concentration was 1.2 μM. The volume of the cell was 2 ml
Fig. 7
Fig. 7
Three models proposed for iron mineralization by ferritins. a Catalysis by the ferroxidase center proposed for the P. furiosus ferritin (PDB 2jd7). Ferrous ions are oxidized in binding sites near the ferroxidase center, e.g., site C, through electron transfer to a stable ferroxidase center and are then released to the cavity to form a core. b Catalysis via a substrate site illustrated for bullfrog M ferritin (PDB1mfr). Ferrous ions are oxidized in the ferroxidase center and are then released to the cavity to form a core. c Catalysis by the core proposed for Escherichia coli bacterioferritin (PDB2htn). Ferrous ions are oxidized on the surface of an active core and electrons are transferred to an oxidant such as molecular oxygen through the ferroxidase center

References

    1. Rucker P, Torti FM, Torti SV. J Biol Chem. 1996;271:33352–33357. doi: 10.1074/jbc.271.52.33352. - DOI - PubMed
    1. Laulhere JP, Lescure AM, Briat JF. J Biol Chem. 1988;263:10289–10294. - PubMed
    1. Liu X, Theil EC. Acc Chem Res. 2005;38:167–175. doi: 10.1021/ar0302336. - DOI - PubMed
    1. Lewin A, Moore GR, Le Brun NE (2005) Dalton Trans 3597–3610 - PubMed
    1. Ferreira C, Bucchini D, Martin ME, Levi S, Arosio P, Grandchamp B, Beaumont C. J Biol Chem. 2000;275:3021–3024. doi: 10.1074/jbc.275.5.3021. - DOI - PubMed

Publication types