. 2009 Oct 1;108(2):433-46.
doi: 10.1002/jcb.22270.

Cholinergic modulation of angiogenesis: role of the 7 nicotinic acetylcholine receptor

Affiliations

Cholinergic modulation of angiogenesis: role of the 7 nicotinic acetylcholine receptor

Jenny C F Wu et al. J Cell Biochem. .

Abstract

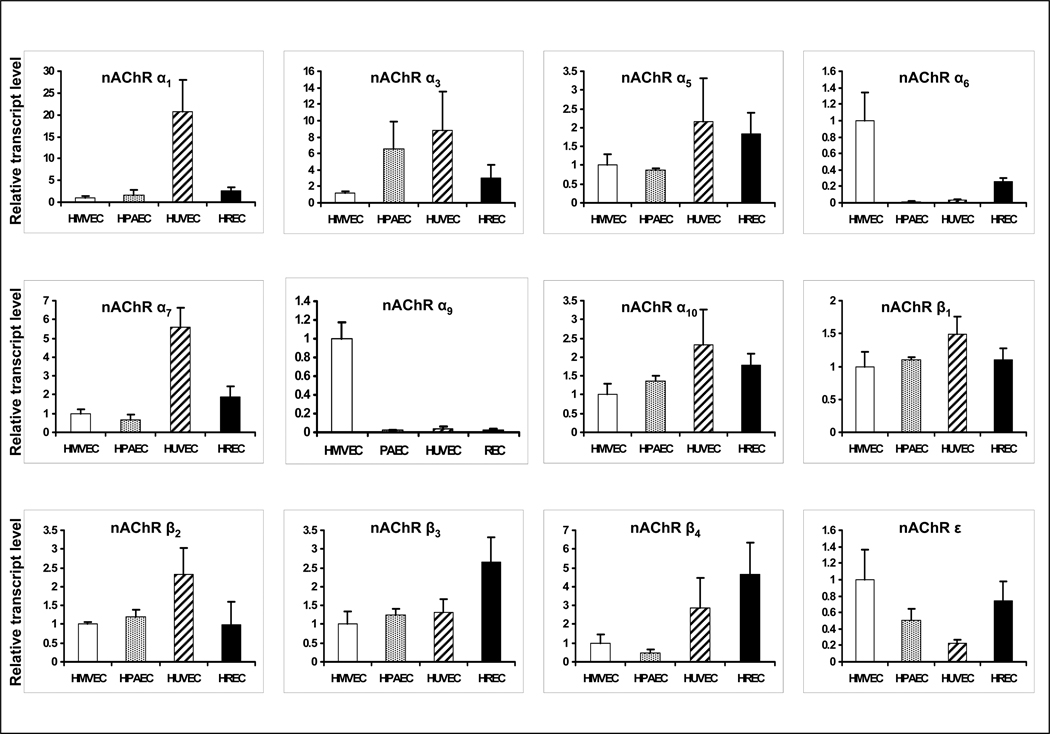
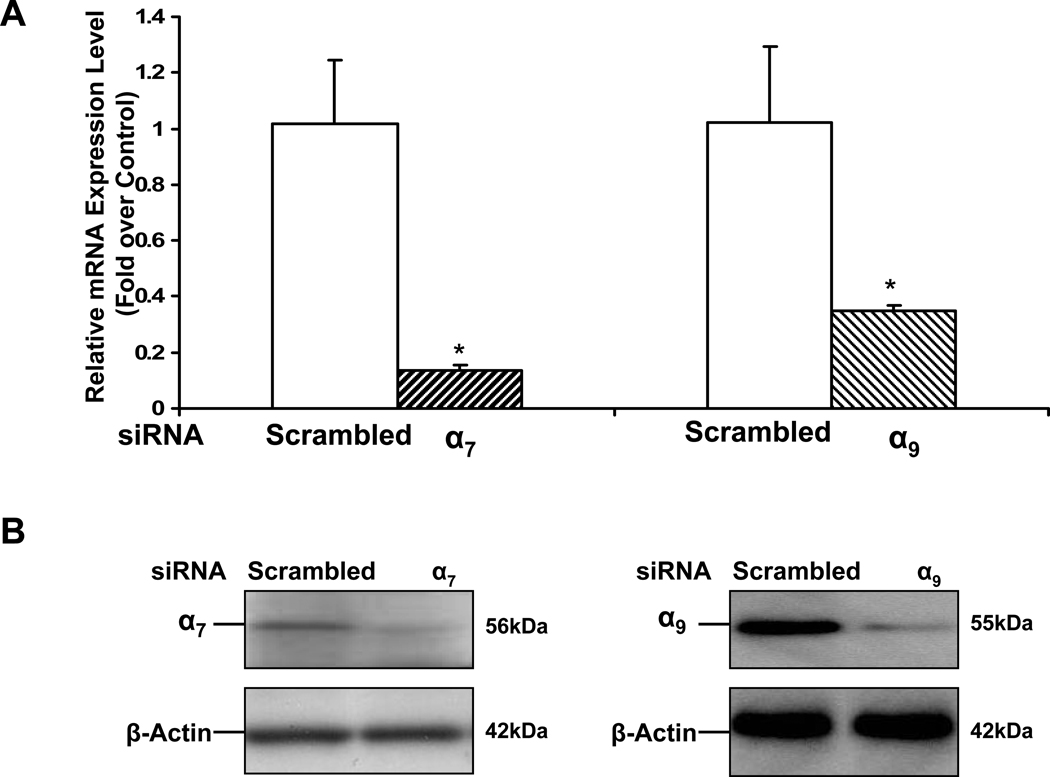
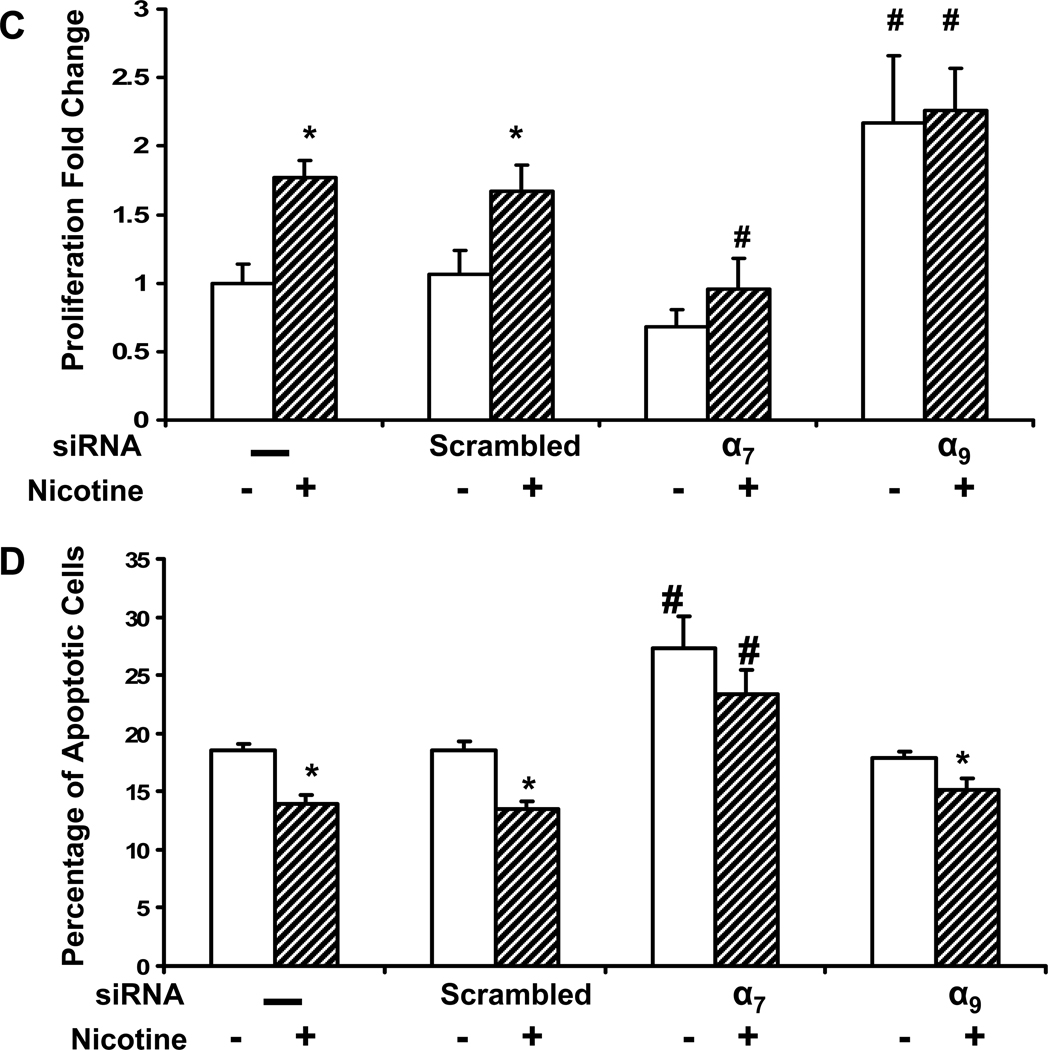
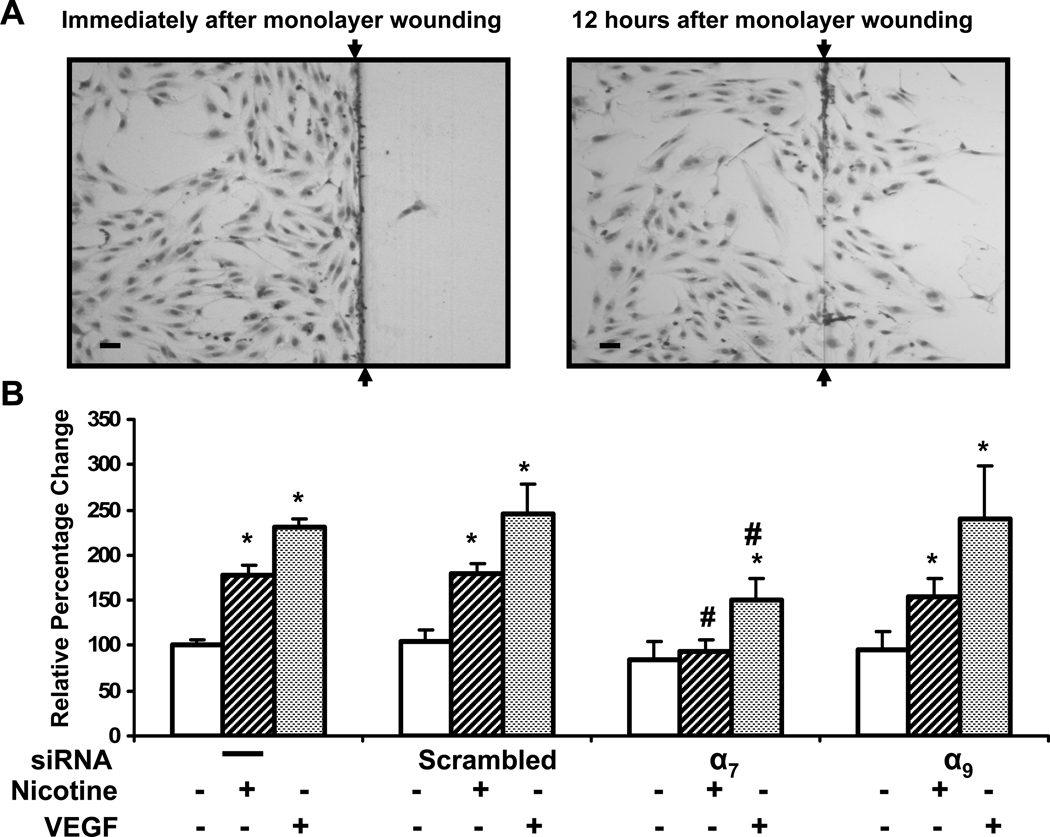
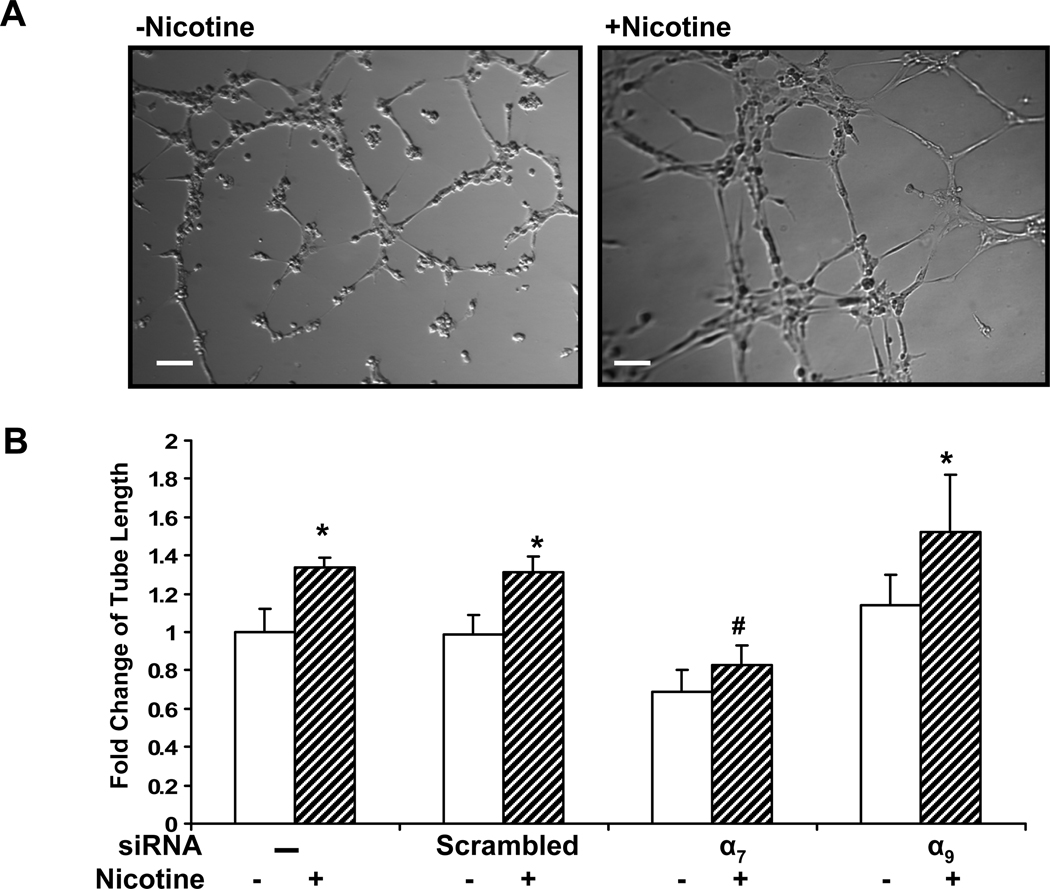
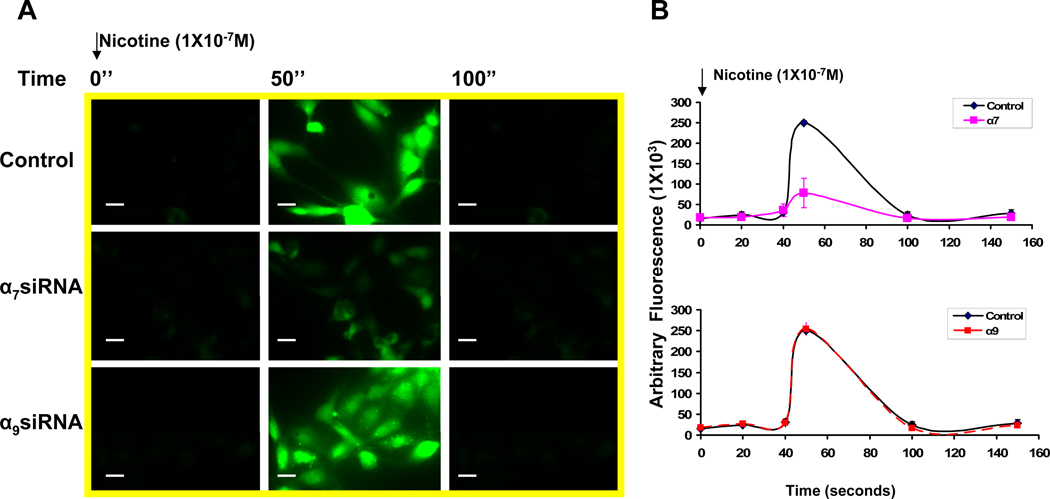
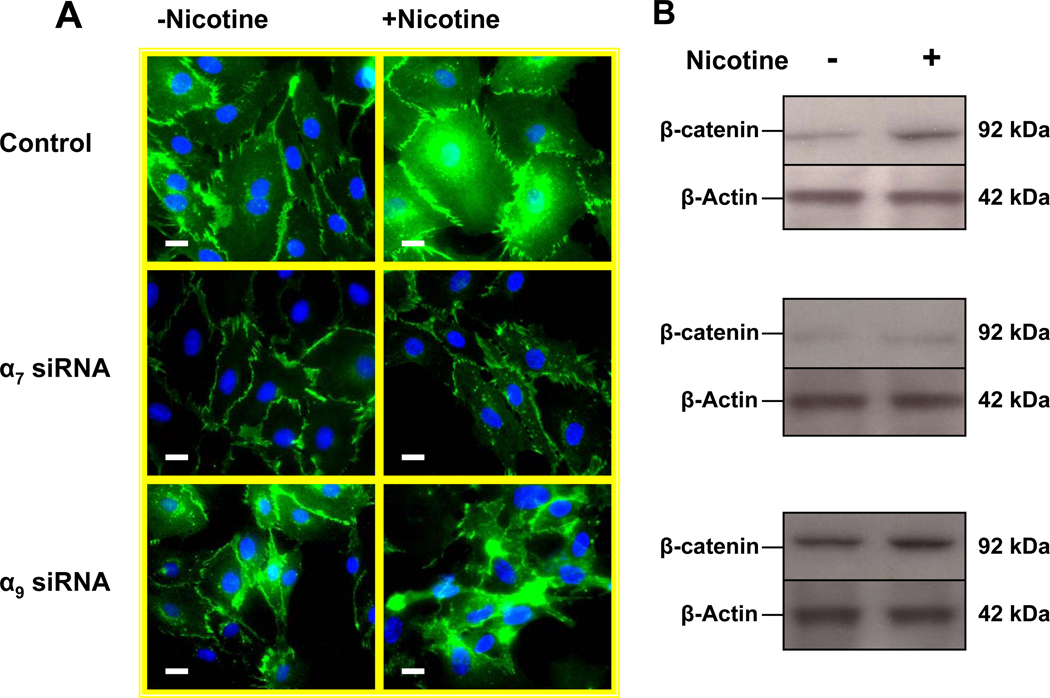
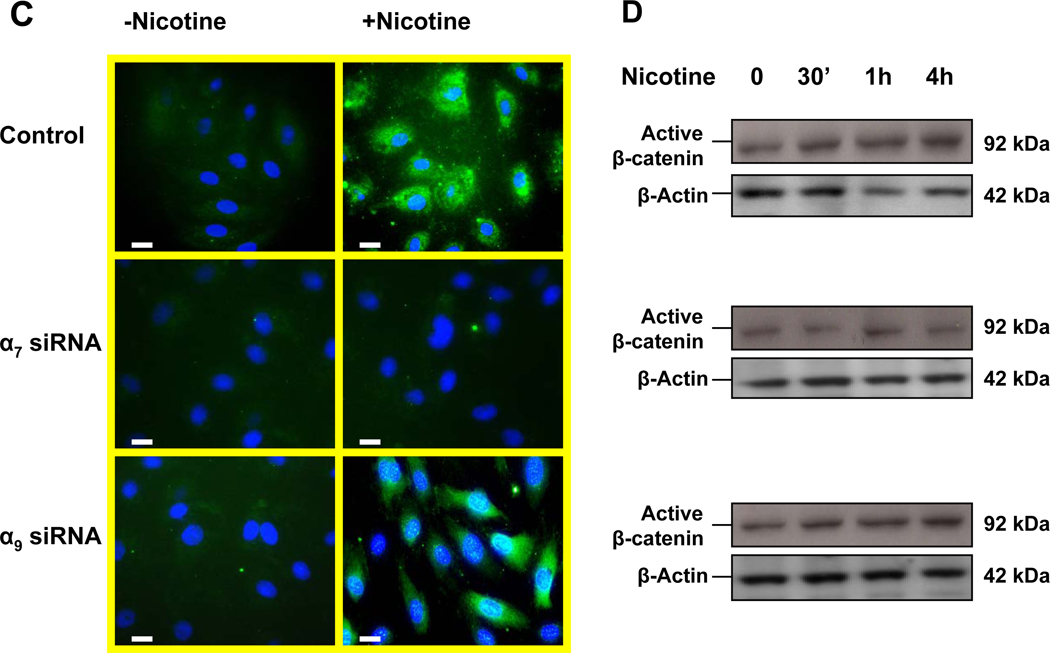
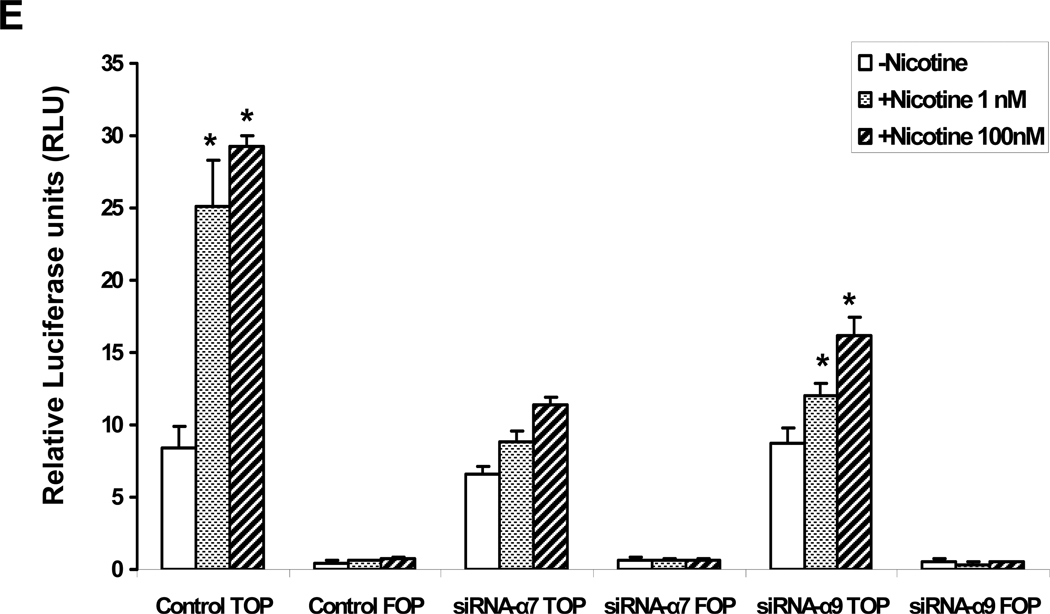
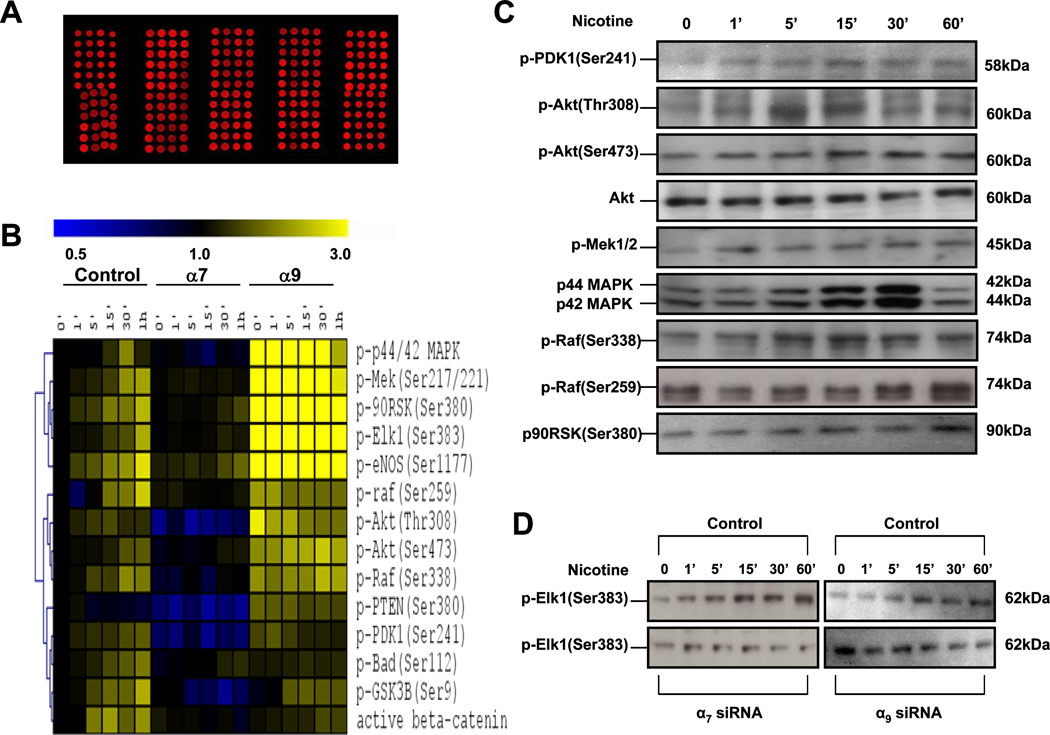
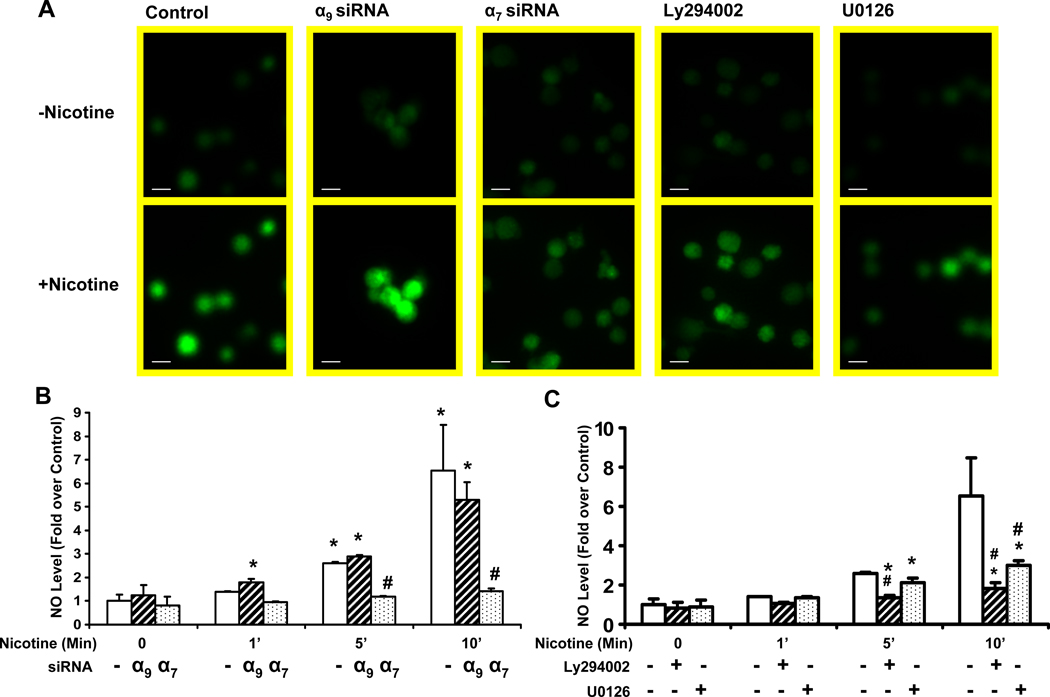
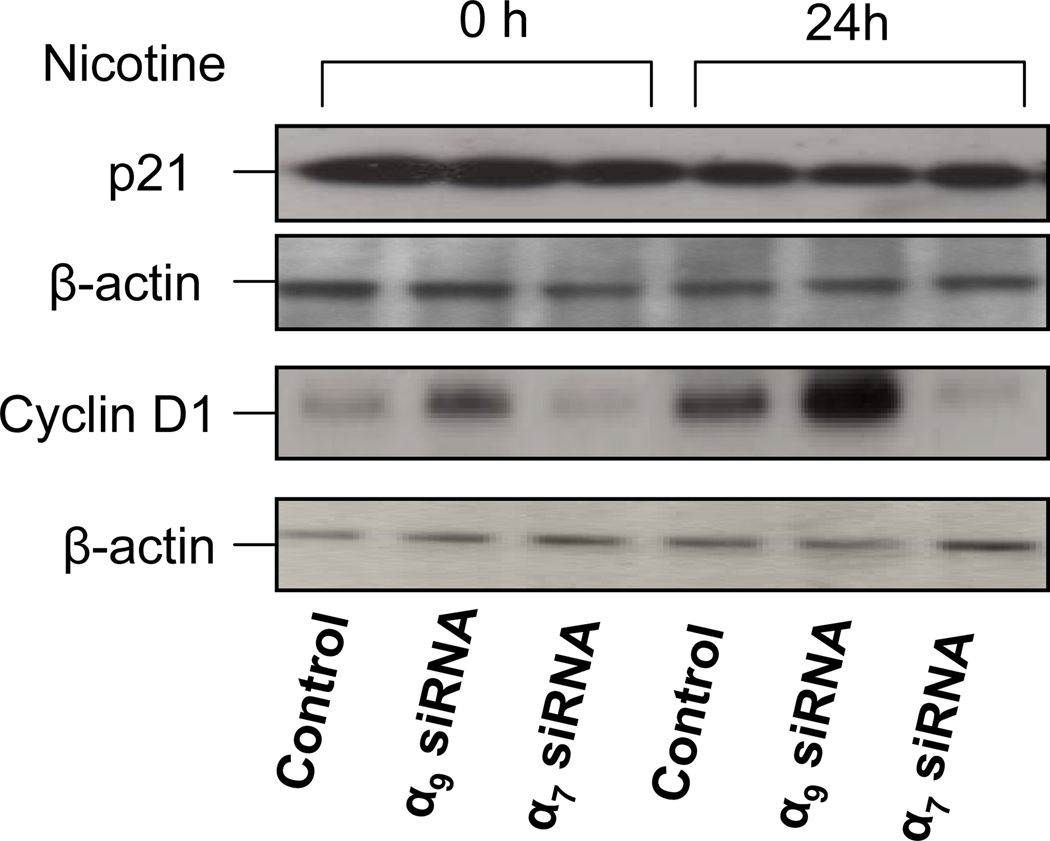
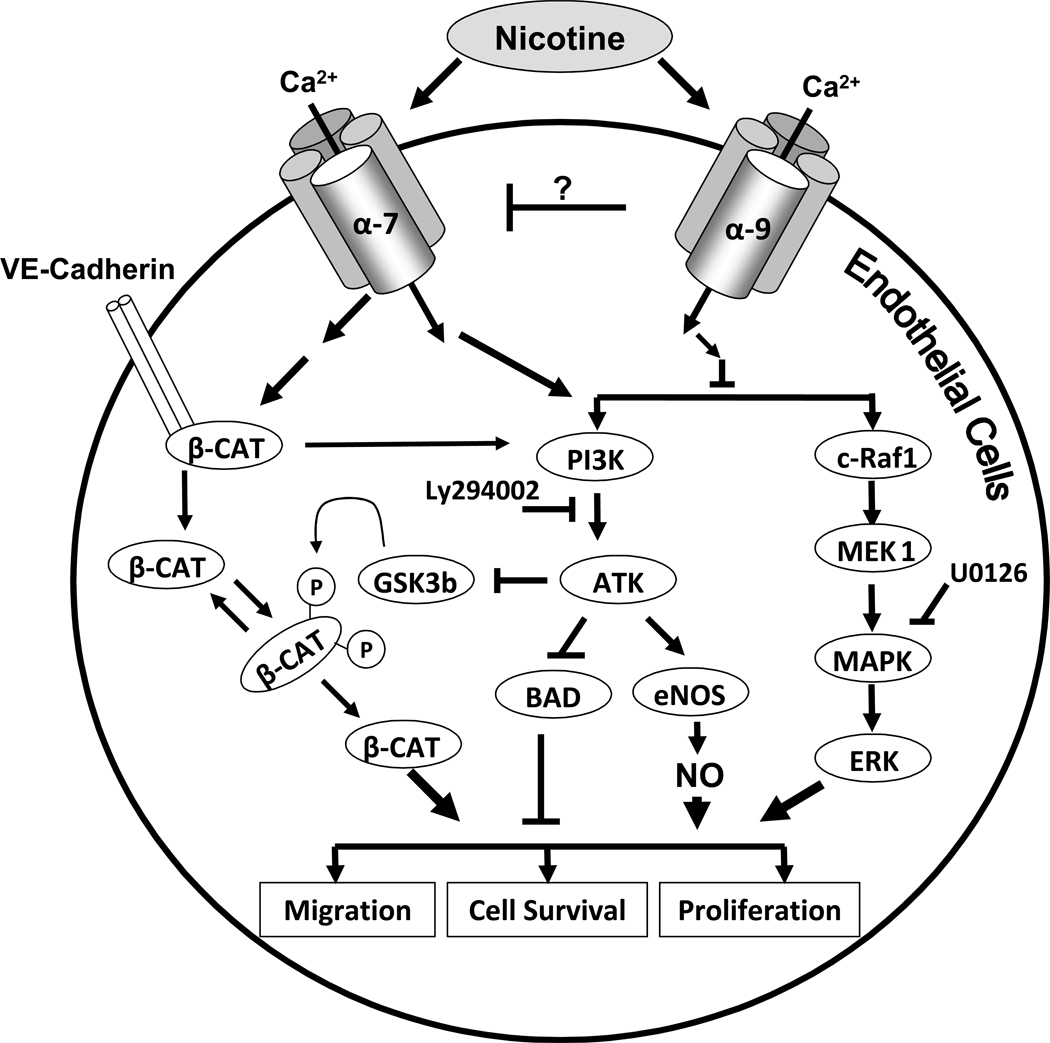
Pathological angiogenesis contributes to tobacco-related diseases such as malignancy, atherosclerosis and age-related macular degeneration. Nicotine acts on endothelial nicotinic acetylcholine receptors (nAChRs) to activate endothelial cells and to augment pathological angiogenesis. In the current study, we studied nAChR subunits involved in these actions. We detected mRNA for all mammalian nAChR subunits except alpha(2), alpha(4), gamma, and delta in four different types of ECs. Using siRNA methodology, we found that the alpha(7) nAChR plays a dominant role in nicotine-induced cell signaling (assessed by intracellular calcium and NO imaging, and studies of protein expression and phosphorylation), as well as nicotine-activated EC functions (proliferation, survival, migration, and tube formation). The alpha(9) and alpha(7) nAChRs have opposing effects on nicotine-induced cell proliferation and survival. Our studies reveal a critical role for the alpha(7) nAChR in mediating the effects of nicotine on the endothelium. Other subunits play a modulatory role. These findings may have therapeutic implications for diseases characterized by pathological angiogenesis.


Figures

Figure 1
Figure 1. Endothelial expression of mRNA for nAChR subunits
Gene expression of nAChR subunits in HMVEC, HPAEC, HUVEC and HREC were assessed by Real-time PCR. The ct values for nAChR subunits were normalized using ct values obtained in parallel for 18S mRNA. Subsequently, these values were expressed as relative transcript levels by comparison to those values determined for HMVEC. Endothelial mRNA was detected for each of the known mammalian nAChR subunits with the exception of α2, α4, γ and δ in each of the four different types of endothelial cells. The data represent the mean of 3 different experiments carried out in triplicate with error bars showing SEM.
Figure 2
Figure 2. nAChR mediated endothelial cell proliferation and survival
To assess the role of the homomeric nAChRs in EC proliferation and survival, siRNA methodology was employed. HMVEC were transfected with siRNA against the α7 or α9 nAChR subunits or scrambled siRNA or exposed to transfection vehicle without siRNA, for 72 hours. (A) Gene silencing of the specific nAChR was validated by RT-PCR. Total RNA was isolated and subjected to RT-PCR. The data represent 3 different experiments carried out in triplicate. The values are expressed as relative fold change of each condition vs. control without siRNA with error bars showing SEM (p<0.05). (B) Gene silencing of the specific nAChR was validated by Western immunoblots for α7 or α9 nAChR and β-Actin expression. (C) Effect of siRNA on EC proliferation. The proliferation assay utilized BrdU incorporation. Nicotine stimulated HMVEC proliferation, an effect that was abrogated by siRNA against α7 nAChR. By contrast, siRNA against α9 nAChR increased basal EC proliferation. Results are shown as fold change (mean±SEM of 3 different experiments each carried out in triplicate) compared to the nonstimulated control cells. *p<0.001 vehicle versus nicotine treated cells. # p<0.05, vs. non-transfected cells exposed to same stimulus. (D) Effect of siRNA on EC survival. Cells were first transfected with siRNA as described in (A). Subsequently, serum free conditions were used to induce apoptosis for 24 hours, then either vehicle or nicotine(10−10M) was added to the medium and the cells were further cultured for another 24 hours. The cell survival assay is described in Materials and methods. *p<0.05 vehicle versus nicotine treated cells. # p<0.05, vs. non-transfected cells exposed to same stimulus.
Figure 3
Figure 3. Role of nAChR subunits in human microvascular EC migration
(A) Representative microphotographs of the HMVEC migration assay. Nicotine (10−8M) stimulates migration of HMVEC into denuded area (Right panel). Bar = 50 µm (B) Effect of silencing individual nAChR on HMVEC migration induced by nicotine (10−8M), or VEGF (10ng/ml). Endothelial cells exposed to scrambled siRNA were used as a control for the effects of transfection. Values are expressed as a percentage of migrating cells per high-powered field (n=12) in vehicle-treated wells with error bars showing SEM. * *p<0.05 versus vehicle treated cells. # p<0.05, vs. non-transfected cells exposed to same stimulus.
Figure 4
Figure 4. Role of nAChR subtypes in EC tube formation
(A) Representative phase-contrast micrographs of tube formation of HMVECs on Matrigel. HDMECs were pretreated with siRNA against each individual nAChR subunit for 72 hours. The cells were seeded on matrigel and incubated at 37°C for 6 h in medium with vehicle (left panel) or with nicotine(10−8M, right panel). Bar, 100 µm. (B) Relative fold change in tube length compared to vehicle treated cells. *p<0.05 versus vehicle treated cells. # p<0.05, vs. non-transfected cells exposed to same stimulus.
Figure 5
Figure 5. Nicotine increases intracellular Ca2+
(A) Fluorescence photomicrograph of HMVEC cells loaded with fluo-4. Nicotine (10−7 M) elevated intracellular Ca2+ as indicated by increase in fluorescence emission intensity: left panels (before stimulation) middle panels (50 seconds after stimulation), and right panels (100 seconds after stimulation). Upper row: control cells; middle row: middle row: response of cells previously exposed to siRNA against α7 for 72 hours; bottom row: response of cells previously exposed to siRNA against α9 for 72 hours. A representative photomicrograph is shown. Bar, 10 um. (B) Time course of fluorescence emission intensity in HMVEC cells loaded with fluo-4. Cell were transfected and stimulated as described in (A). The values are expressed as arbitrary fluorescence intensity. The average of ten measurements (without baseline subtraction) in the assay were plotted.
Figure 6
Figure 6. The α7 nAChR is necessary for nicotine-induced activation of β-catenin
(A). In untreated HMVEC (upper left panel) β-catenin was immunolocalized to the membrane; HMVEC exposed to nicotine(10−8M) for 24 hours manifested an increase in β-catenin in the cytoplasm and nucleus (upper right panel); HMVEC were exposed to transfection vehicle (upper panels) or transfected with siRNA against α7 (middle panels) or α9 (bottom panels) for 72 hours and then exposed to vehicle (left panels) or to 10−8 M nicotine (right panels) for 24hours. Hoechst staining (blue) for nuclei, and FITC staining for β-catenin (green). Bar = 5 µm. (B) Representative Western immunoblots for β-catenin and β-Actin in response to nicotine stimulation for 24 hours in control cells, siRNA-α7 transfected cells, and siRNA-α9 transfected cells. (C) Active β-catenin accumulation in both nuclei and cytoplasm were observed by immunofluorescence 4 hours after stimulation by nicotine (10−8M) in control and siRNA-α9 transfected cells, but not siRNA-α7 transfected cells. (D) Immunoblotting for active β-catenin showed an increase which peaked 30 minutes after nicotine stimulation, an effect that was blocked by siRNA against α7 but not α9 nAChR gene expression. (E) Effect of nicotine on T-cell factor (TCF) activity. HMVEC were transfected, siRNA against α7 or α9 or with scrambled siRNA for 48 hours and subsequently transfected with TOPflash, a TCF-responsive firefly luciferase reporter plasmid for another 24 hours. Some cells were transfected with FOPflash, which contains mutant TCF binding sites, for use as a negative control. Cells were also transfected with pRL-TK, a Renilla luciferase plasmid which was used for normalization of transfection efficiency. Luciferase activity was analyzed 4 hours after addition of nicotine to the cells. Values are TOPflash RLUs from 3 different experiments. Error bars represent mean ±SEM, * p< 0.05 vs. unstimulated control.
Figure 7
Figure 7. Reverse phase protein (RPP) microarray profiling of nicotine stimulated ECs
(A) Lysates derived from control cells or cells pretreated with siRNA against each nAChR subunit were quantified by protein amount and printed on nitrocellulose-coated slides in 3 triplicates. Fluorescent image of a representative RPP microarray probed with a primary antibody specific for the phospho-c-Raf is shown. Each 4 × 12 subarray contains lysates derived from a single nAChR knockdown subunit. Each feature on the array is approximately 400 µm in diameter. (B) Hierarchical cluster analysis of phosphorylation protein kinetics effects of nicotine in HMVECs. The first seven columns display data from control lysates from HMVECs. The middle seven columns display data from HMVECs in which the α7 subunit was knocked down and the last set of seven columns display data in which α9 receptor was knocked down. Within each set of columns, there is a time course from 0 to 60 minutes. Yellow denotes increased staining and blue denotes decreased staining compared to the control HMVEC lysate at the 0 time point. The intensity of the color reflects the magnitude of the change from baseline. The dendrogram on the left of matrix represents similarities in patterns of activity among phosphoproteins. (C)–(D) Corresponding immunoblots for the phosphoproteins in the microarray.
Figure 8
Figure 8. Nicotine increases NO production
(A) HMVECs were loaded with DAF-FM DA (20 µM) as described in Material and Methods. Increasing fluorescence intensity reflects NO synthesis. Representative results are shown. Upper panels show basal fluorescence intensity before stimulation. Bottom panels show fluorescence 15 minutes after nicotine(10−7 M) stimulation. From left to right: panel1: Control cells, treated with transfection vehicle for 72 hrs prior to nicotine stimulation; panel2 :cells treated with siRNA against α9 preceding the nicotine stimulation. panel3: cells pretreated with siRNA against α7 prior to nicotine stimulation. panel4: cells pretreated with PI3 kinase inhibitor Ly294003 (50 uM) for 1 hour followed by nicotine stimulation. panel5: cells pretreated with U0126 (20 uM) for 1 hour followed by nicotine stimulation. Bar = 20 µm. (B)–(C) Measurement of the intracellular NO level. The average intensities in the ECs relative to the control group were evaluated as described in materials and methods. n=10, *p<0.05 versus control (non-transfected) cells at time 0. # p<0.05, vs. non-transfected cells exposed to same stimulus duration.
Figure 9
Figure 9. Cyclin D1 activity is increased by nicotine
Immunoblotting for p21 and cyclin D1. Cells were exposed to siRNA against α9 or α7 for 72 hour. Then cells were serum starved overnight and subsequently stimulated with nicotine (10−10M) for 24 hours. The lysates were subjected to Western analysis with anti-p21, anti-cyclin D1 antibodies. Equal protein loading was determined by anti-β-actin antibody.
Figure 10
Figure 10
Schematic representation of nicotine signal transduction pathways. Nicotine activates α7-nAChRs, triggering an initial cytosolic influx of Ca2+, which activates two major signaling pathways (PI3/Akt and MAPK cascade, respectively) resulting in the promotion of cell proliferation, survival and migration. The activation of MAPK and Akt increases NO synthesis, which also promotes EC proliferation, survival and migration. Nicotine causes disassembly of the VE-Cadherin/ β-catenin complex and translocation of β-catenin to the nucleus. By contrast, nicotine binding to α9 opposes this signaling pathway through an unknown mechanism.

References

    1. Barbieri Ruggiero, Tremoli, Weksler Suppressing PTEN Activity by Tobacco Smoke Plus Interleukin-1 β Modulates Dissociation of VE-Cadherin/β-Catenin Complexes in Endothelium. Arteriosclerosis, thrombosis, and vascular biology. 2008 - PubMed
    1. Barbieri SS, Weksler BB. Tobacco smoke cooperates with interleukin-1beta to alter beta-catenin trafficking in vascular endothelium resulting in increased permeability and induction of cyclooxygenase-2 expression in vitro and in vivo. The FASEB journal. 2007;21:1831–1843. - PubMed
    1. Behrens J, von Kries JP, Kahl M, Bruhn L, Wedlich D, Grosschedl R, Birchmeier W. Functional interaction of beta-catenin with the transcription factor LEF-1. Nature. 1996;382:638–642. - PubMed
    1. Boulter J, Connolly J, Deneris E, Goldman D, Heinemann S, Patrick J. Functional expression of two neuronal nicotinic acetylcholine receptors from cDNA clones identifies a gene family. Proceedings of the National Academy of Sciences of the United States of America. 1987;84:7763–7767. - PMC - PubMed
    1. Chan SM, Ermann J, Su L, Fathman CG, Utz PJ. Protein microarrays for multiplex analysis of signal transduction pathways. Nature medicine. 2004;10:1390–1396. - PubMed

Publication types

MeSH terms

LinkOut - more resources