. 2009 Nov 1;125(9):2198-204.
doi: 10.1002/ijc.24601.

Hypoxia induces chemoresistance in ovarian cancer cells by activation of signal transducer and activator of transcription 3

Affiliations

Hypoxia induces chemoresistance in ovarian cancer cells by activation of signal transducer and activator of transcription 3

Karuppaiyah Selvendiran et al. Int J Cancer. .

Abstract

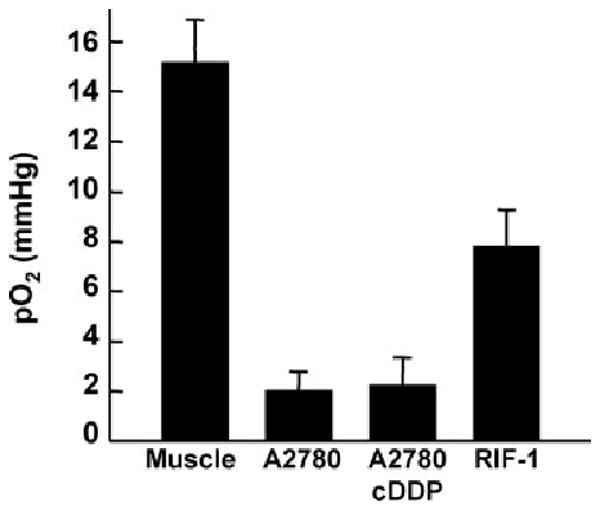
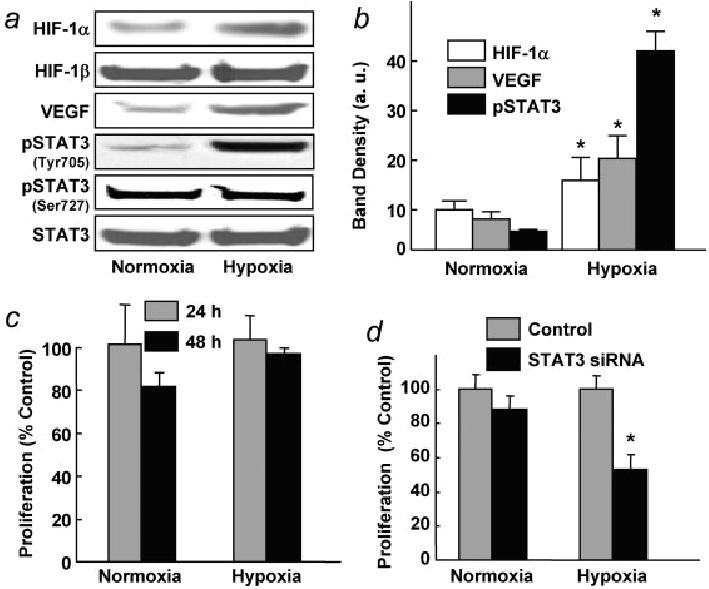
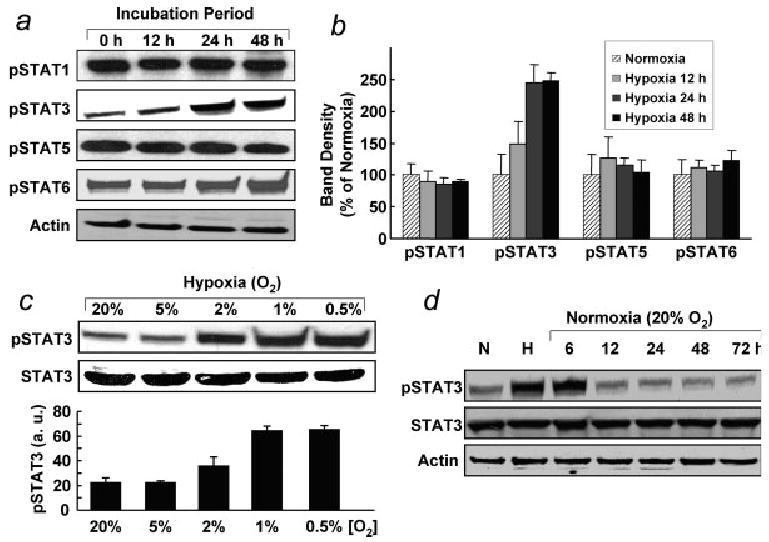
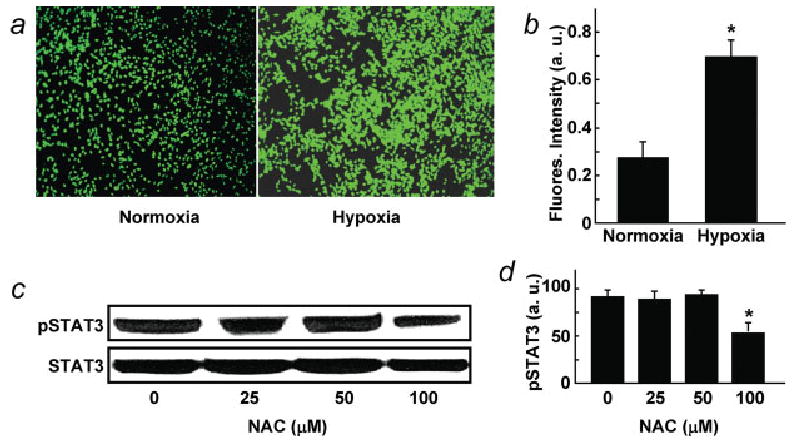
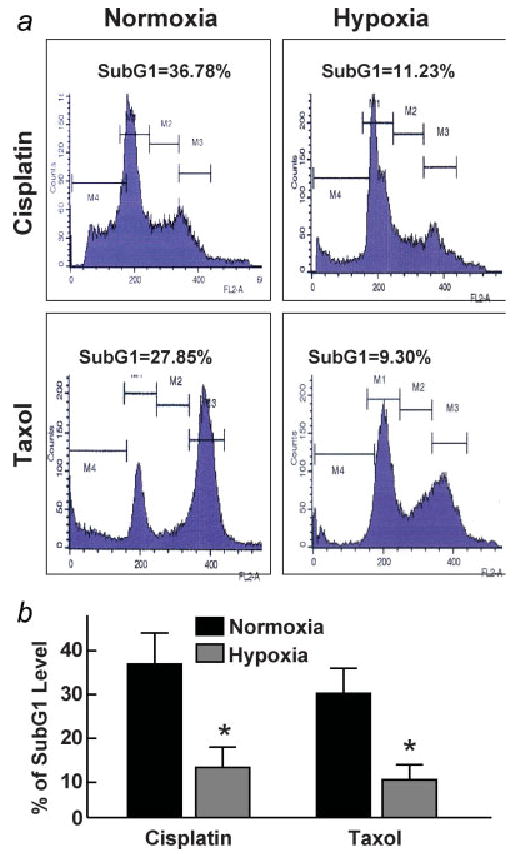
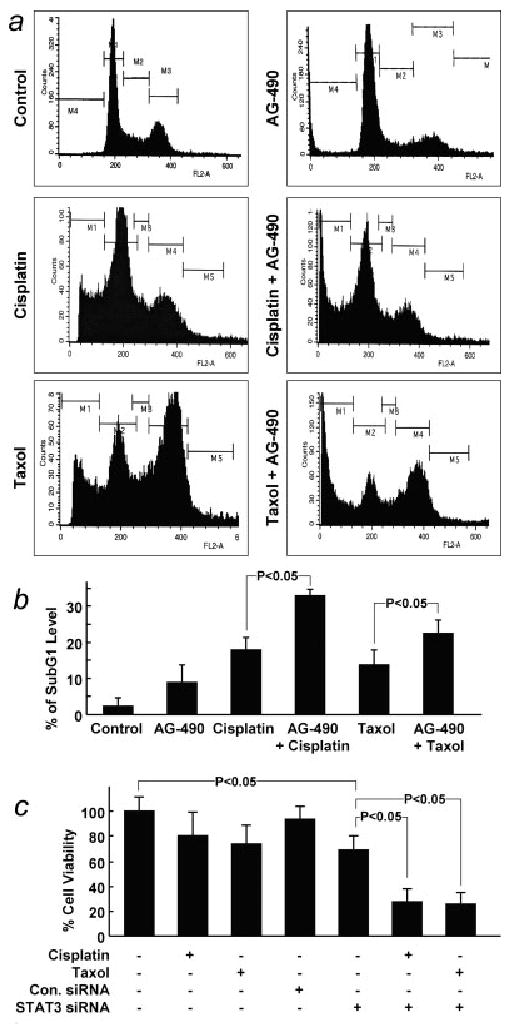
Signal transducer and activator of transcription 3 (STAT3) is activated in a variety of human cancers, including ovarian cancer. The molecular mechanism by which the STAT3 is activated in cancer cells is poorly understood. We observed that human ovarian xenograft tumors (A2780) in mice were severely hypoxic (pO(2) approximately 2 mmHg). We further observed that hypoxic exposure significantly increased the phosphorylation of STAT3 (pSTAT3) at the Tyr705 residue in A2780 cell line. The pSTAT3 (Tyr705) level was highly dependent on cellular oxygenation levels, with a significant increase at <2% O(2), and without any change in the pSTAT3 (Ser727) or total STAT3 levels. The pSTAT3 (Tyr705) elevation following hypoxic exposure could be reversed within 12 hr after returning the cells to normoxia. The increased level of pSTAT3 was partly mediated by increased levels of reactive oxygen species generation in the hypoxic cancer cells. Conventional chemotherapeutic drugs cisplatin and taxol were far less effective in eliminating the hypoxic ovarian cancer cells suggesting a role for pSTAT3 in cellular resistance to chemotherapy. Inhibition of STAT3 by AG490 followed by treatment with cisplatin or taxol resulted in a significant increase in apoptosis suggesting that hypoxia-induced STAT3 activation is responsible for chemoresistance. The results have important clinical implications for the treatment of hypoxic ovarian tumors using STAT3-specific inhibitors.


Figures

Figure 1
Figure 1
Partial pressure of oxygen (pO2) in A2780 xenograft tumors in mice. Shown are pO2 values obtained from A2780 (human ovarian), A2780 cDDP (cisplatin-resistant variant of A2780) and RIF-1 (radiation-induced fibrosarcoma) tumors grown by subcutaneous implantation of respective cells in the hind limb of mice. The measurements were performed by in vivo EPR oximetry when the tumor size was about 12 mm in diameter. For comparison, the pO2 value measured from the gastrocnemius muscle tissue of control (nontumor) mice is also shown. Data represent mean ± SE from 5 mice per group. The results show that the ovarian xenograft tumors are severely hypoxic when compared with RIF-1 tumor or muscle tissue.
Figure 2
Figure 2
Effect of hypoxia on STAT3 activation in human ovarian cancer cells. Cells were cultured under normoxic (20% O2) or hypoxic (1% O2) conditions. (a) Representative Western blots of HIF-1α, VEGF, pSTAT3 (Tyr705), pSTAT3 (Ser727) and STAT3 are shown. (b) Quantification of HIF-1α, VEGF and pSTAT3 blots from triplicate experiments. All 3 protein levels were significantly upregulated (*p < 0.05) in the hypoxic cells. (c) Cell-proliferation data obtained using anti-BrdU assay at 24- and 48-hr exposure to hypoxia. (d) Effect of STAT3 siRNA transfection on the proliferation of cells cultured under normoxic and hypoxic conditions. STAT3 siRNA significantly (*p < 0.05) reduced cell proliferation in the hypoxic cells.
Figure 3
Figure 3
Activation of STAT proteins in ovarian cancer cells cultured under hypoxic conditions. (a) Phosphorylated STATs after exposure to hypoxia for 0 (normoxia), 12, 24 and 48 hr. There was no change in the levels of pSTAT1, pSTAT5 and pSTAT6 when compared with cells cultured under normoxic conditions, whereas pSTAT3 level was enhanced in a time-dependent manner. (b) Quantification of band density of pSTATs from triplicate experiments. (c) Magnitude of pSTAT3 as a function of hypoxic exposure level. The pSTAT3 level was significantly enhanced in cells cultured at 2, 1 and 0.5% O2. (d) After 48 hr of incubation under hypoxia (H, 1% O2), cells were returned to normoxic culture (20% O2) for 72 hr. The level of pSTAT3 was reversed after 12 hr or more on return to normoxic culture.
Figure 4
Figure 4
ROS levels in ovarian cancer cells cultured under normoxic (20% O2) and hypoxic (1% O2) conditions for 24 hr. (a) Dicarboxy-fluorescein diacetate (DCF-DA) fluorescence images of normoxic and hypoxic-cultured cells. (b) DCF-DA fluorescence intensity showing the ROS level in hypoxic cells was significantly (*p < 0.05) greater than normoxic cells. (c) Western blots of pSTAT3 in cells cultured under hypoxic conditions in presence of N-acetyl cysteine (NAC), a known ROS inhibitor. (d) Quantification of band density of C from triplicate experiments. Inhibition pSTAT3 upregulation was significant at 100 μM NAC concentration (*p < 0.05).
Figure 5
Figure 5
Effect of cisplatin or taxol exposure on the subG1 population of ovarian cancer cells cultured under normoxic or hypoxic conditions for 24 hr. Cells were treated with cisplatin (100 μM) or taxol (50 μM) for 48 hr. The cells were then collected and analyzed for subG1 levels using flow cytometry. (a) Representative flow-cytogram of cells. (b) Quantification of subG1 level as a percentage of total cells in triplicate experiments. The data show a significant difference in the chemotherapeutic efficacy between the hypoxic and normoxic cells. *p < 0.05 versus corresponding normoxic group.
Figure 6
Figure 6
Effect of STAT3 inhibition on the subG1 population and viability of ovarian cancer cells cultured under hypoxic conditions for 24 hr. AG490 (50 μM), an indirect inhibitor of STAT3, was used to inhibit STAT3. Cells were treated with AG490 alone, cisplatin (100 μM), taxol (50 μM), cisplatin + AG490 or taxol + AG490 for 24 hr in hypoxic culture (1% O2). (a) Representative flow cytogram of cells. (b) Quantification of subG1 level as a percentage of total cells in triplicate experiments. (c) The effect of STAT3 suppression, achieved by transfection with STAT3 siRNA, on the viability (by MTT assay) of cells treated with cisplatin (100 μM) or taxol (50 μM) under hypoxic conditions.

References

    1. Brown JM, Wilson WR. Exploiting tumour hypoxia in cancer treatment. Nat Rev Cancer. 2004;4:437–47. - PubMed
    1. Bratasz A, Pandian RP, Deng Y, Petryakov S, Grecula JC, Gupta N, Kuppusamy P. In vivo imaging of changes in tumor oxygenation during growth and after treatment. Magn Reson Med. 2007;57:950–9. - PMC - PubMed
    1. Krohn KA, Link JM, Mason RP. Molecular imaging of hypoxia. J Nucl Med. 2008;49(Suppl 2):S129–48. - PubMed
    1. Brown JM. Exploiting the hypoxic cancer cell: mechanisms and therapeutic strategies. Mol Med Today. 2000;6:157–62. - PubMed
    1. Xia C, Meng Q, Liu LZ, Rojanasakul Y, Wang XR, Jiang BH. Reactive oxygen species regulate angiogenesis and tumor growth through vascular endothelial growth factor. Cancer Res. 2007;67:10823–30. - PubMed

Publication types