. 2009 Aug 21;4(8):673-84.
doi: 10.1021/cb900112v.

Novel pentameric thiophene derivatives for in vitro and in vivo optical imaging of a plethora of protein aggregates in cerebral amyloidoses

Affiliations

Novel pentameric thiophene derivatives for in vitro and in vivo optical imaging of a plethora of protein aggregates in cerebral amyloidoses

Andreas Aslund et al. ACS Chem Biol. .

Abstract

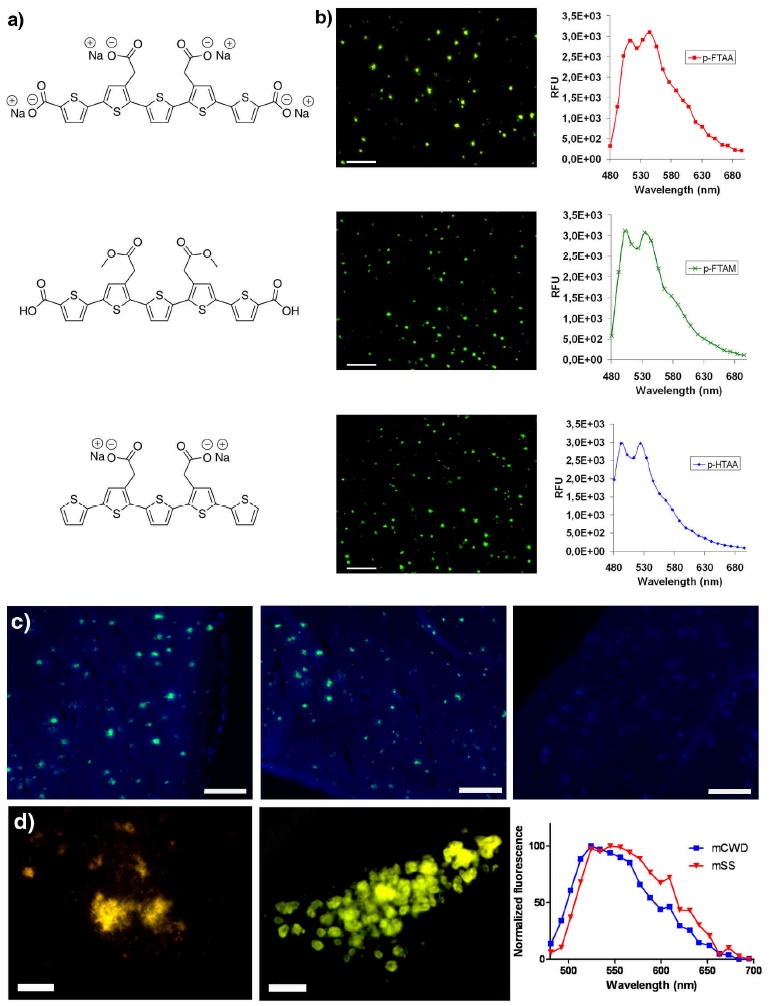
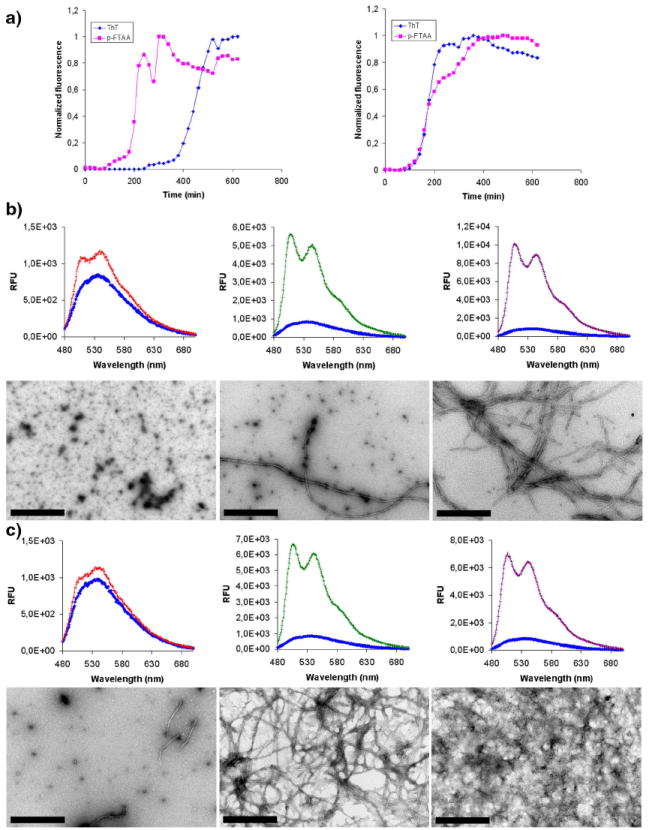
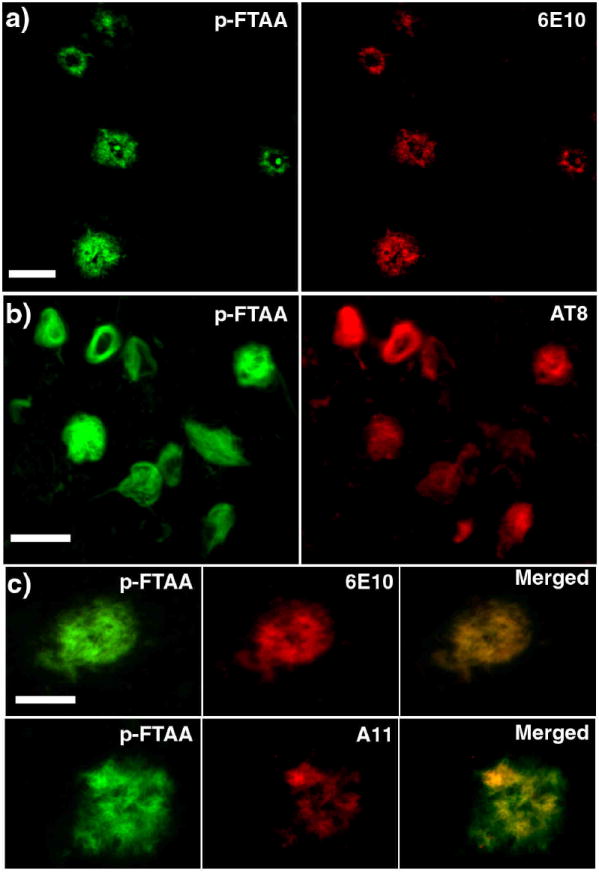
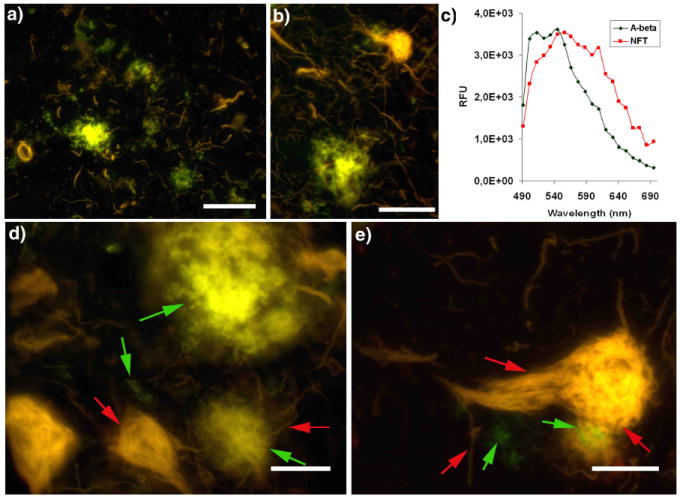
Molecular probes for selective identification of protein aggregates are important to advance our understanding of the molecular pathogenesis underlying cerebral amyloidoses. Here we report the chemical design of pentameric thiophene derivatives, denoted luminescent conjugated oligothiophenes (LCOs), which could be used for real-time visualization of cerebral protein aggregates in transgenic mouse models of neurodegenerative diseases by multiphoton microscopy. One of the LCOs, p-FTAA, could be utilized for ex vivo spectral assignment of distinct prion deposits from two mouse-adapted prion strains. p-FTAA also revealed staining of transient soluble pre-fibrillar non-thioflavinophilic Abeta-assemblies during in vitro fibrillation of Abeta peptides. In brain tissue samples, Abeta deposits and neurofibrillary tangles (NFTs) were readily identified by a strong fluorescence from p-FTAA and the LCO staining showed complete co-localization with conventional antibodies (6E10 and AT8). In addition, a patchy islet-like staining of individual Abeta plaque was unveiled by the anti-oligomer A11 antibody during co-staining with p-FTAA. The major hallmarks of Alzheimer's disease, namely, Abeta aggregates versus NFTs, could also be distinguished because of distinct emission spectra from p-FTAA. Overall, we demonstrate that LCOs can be utilized as powerful practical research tools for studying protein aggregation diseases and facilitate the study of amyloid origin, evolution and maturation, Abeta-tau interactions, and pathogenesis both ex vivo and in vivo.


Figures

Figure 1
Figure 1. Chemical structures, emission spectra and fluorescence images of the pentameric LCPs upon binding to Aβ deposits in formalin-fixed tissue samples fromttransgenic mice with AD pathology, and ex vivo imaging of protein deposits in mice after intravenous or intracerebral injections with LCOs
a) Chemical structure of the sodium salt of pentamer formyl thiophene acetic acid (p-FTAA, top), pentamer formyl thiophene acetic methyl (p-FTAM, middle) and the sodium salt of pentamer hydrogen thiophene acetic acid (p-HTAA). b) Fluorescence images and emission spectra of Aβ deposits in tissue sections from APP/PS1 transgenic mice labeled by p-FTAA (top), p-FTAM (middle) or p-HTAA (bottom). All of the stains were performed with the LCOs diluted in PBS. Scale bars = 200 μm. c) Ex vivo fluorescence images of cerebral amyloid plaques in brain crysosections from APP/PS1 mice that have been intavenously injected with p-FTAA (top), p-FTAM (middle) and p-HTAA (bottom). The images were recorded using a blue filter (LP 450) and a green filter (LP 515). After the i.v. injection of p-FTAA and p-HTAA the staining of the Aβ deposits are seen in characteristic green color, whereas upon injection of p-FTAM only blue autofluorescence from the deposits and the background are observed. Scale bars = 200 μm. d) Ex vivo fluorescence image of p-FTAA-labeled prion deposits in mice infected with mouse-adapted sheep scrapie, mSS (left) or mouse-adapted chronic wasting disease, mCWD (middle) that have been intracerebrally injected with p-FTAA. Typical emission spectra from p-FTAA (bottom) upon binding to mCWD (blue) or mSS (red) deposits. Scale bars represent 50 μm.
Figure 2
Figure 2. Recombinant Aβ 1-40 and Aβ 1-42 fibrillation monitored with ThT or p-FTAA fluorescence and TEM
a) Time plots of the kinetics of recombinant Aβ 1-40 (left) and Aβ 1-42 (right) fibrillation monitored by ThT fluorescence (blue) or p-FTAA fluorescnce (magenta). For Aβ 1-42 both of the dyes showed similar kinetics, whereas p-FTAA reacts much earlier than ThT during the fibrillation of Aβ 1-40. b) Fluorescence spectra of p-FTAA and the corresponding TEM micrographs after 120 min (left), 220 min (middle) and 600 min of Aβ 1-40 fibrillation. A high amount of smaller oligomeric species are present at 120 min, whereas a mixture of oligomers and fibrils are observed after 220 min. At 600 min only matured fibrils are observed. c) Fluorescence spectra of p-FTAA and the corresponding TEM micrographs after 100 min (left), 200 min (middle) and 600 min of Aβ 1-42 fibrillation. A small amount of smaller oligomeric species and fibrils are present at 100 min, whereas mature fibrils are observed at both 200 min and 600 min. The fibrillation experiments were performed in 10 mM Na-phosphate pH 7.5 with repetitive agitation with a concentration of 10 μM Aβ peptide and 0.3 μM of the respective dye present during fibrillation.
Figure 3
Figure 3. Fluorescence images showing the co-localization of conventional immunohistochemical dyes and p-FTAA bound to pathogenic hallmarks in human AD tissue sections
a) Fluorescence images showing an overview of Aβ deposits stained by p-FTAA (green) and 6E10 (Aβ amyloid) (red). Scale bar represent 50 μm b) Fluorescence images showing an overview of NFTs stained by p-FTAA (green) and AT8 (NFTs) (red). Scale bar represent 20 μm c) High magnification fluorescence images comparing Aβ deposits stained by p-FTAA (green) and 6E10 (red) or p-FTAA (green) and A11 (oligomeric Aβ) (red). The p-FTAA and 6E10 shows perfect co-localization, whereas the A11 only partially co-localize with the p-FTAA staining. Scale bar represent 20 μm. The p-FTAA and the corresponding antibody staining were performed on the same sections. All the images were recorded with an epifluorescence microscope (Zeiss Axiovert A200 Mot inverted microscope) equipped with a SpectraCube® (Optical head) module, using a combination of a 470/40 nm bandpass filter (LP515) and a 546/12 nm bandpass filter (LP590). The integration time used for recording these images were typically 1-5 ms for p-FTAA and 100-500 ms for the antibodies, indicating a superior sensitivity for the LCO compared to immunofluorescence.
Figure 4
Figure 4. High resolution fluorescence images and emission spectra of p-FTAA bound to pathogenic hallmarks in AD
a-b) High resolution fluorescence images showing an overview of the interplay between Aβ deposits (green), neurofibrillary tangles (NFTs) and dystrophic neurites (yellow red). c) Emission spectra of p-FTAA bond to Aβ aggregates (green spectrum) or NFTs (red spectrum). Spectra were recorded with an LSM 510 META (Carl Zeiss, Jena, Germany) confocal laser scanning d-e) High resolution fluorescence images showing the details of the interplay between Aβ deposits (green), neurofibrillary tangles (NFTs) and dystrophic neurites (yellow red). Selected Aβ deposits and neurofibrillary tangles (NFTs), are highlighted (green and red arrows, respectively) to indicate striking spacial co-localization. All the images were recorded with an epifluorescence microscope (Zeiss Axiovert A200 Mot inverted microscope) equipped with a SpectraCube® (Optical head) module, using a 470/40 nm bandpass filter (LP515) (Image a, b, d), or a combination of a 470/40 nm bandpass filter (LP515) and a 546/12 nm bandpass filter (LP590) (Image e). Scale bar = 50 μm (a), 20 μm (b) and 10 μm (d-e).
Scheme 1
Scheme 1
Reagents and conditions: (i) NIS, chloroform/acetic acid (1:1); (ii) K2CO3, PEPPSI-IPr, toluene/methanol (1:1); (iii) NaOH, H2O/dioxane (1:1); (iv) NaOH, H2O

References

    1. DeKosky ST, Marek K. Looking backward to move forward: early detection of neurodegenerative disorders. Science. 2003;302:830–834. - PubMed
    1. Klunk WE, Bacskai BJ, Mathis CA, Kajdasz ST, McLellan ME, Frosch MP, Debnath ML, Holt DP, Wang Y, Hyman BT. Imaging Abeta plaques in living transgenic mice with multiphoton microscopy and methoxy-X04, a systemically administered Congo red derivative. J Neuropathol Exp Neurol. 2002;61:797–805. - PubMed
    1. Nesterov EE, Skoch J, Hyman BT, Klunk WE, Bacskai BJ, Swager TM. In vivo optical imaging of amyloid aggregates in brain: design of fluorescent markers. Angew Chem Int Ed. 2005;44:5452–5456. - PubMed
    1. Mathis CA, Bacskai BJ, Kajdasz ST, McLellan ME, Frosch MP, Hyman BT, Holt DP, Wang Y, Huang GF, Debnath ML, Klunk WE. A lipophilic thioflavin-T derivative for positron emission tomography (PET) imaging of amyloid in brain. Bioorg Med Chem Lett. 2002;12:295–298. - PubMed
    1. Kung MP, Hou C, Zhuang ZP, Skovronsky DM, Zhang B, Gur TL, Trojanowski JQ, Lee VM, Kung HF. Radioiodinated styrylbenzene derivatives as potential SPECT imaging agents for amyloid plaque detection in Alzheimer’s disease. J Mol Neurosci. 2002;19:7–10. - PubMed

Publication types

MeSH terms