

Profiling human serum antibodies with a carbohydrate antigen microarray
- PMID: 19624168
- PMCID: PMC2738755
- DOI: 10.1021/pr900515y
Profiling human serum antibodies with a carbohydrate antigen microarray
Abstract
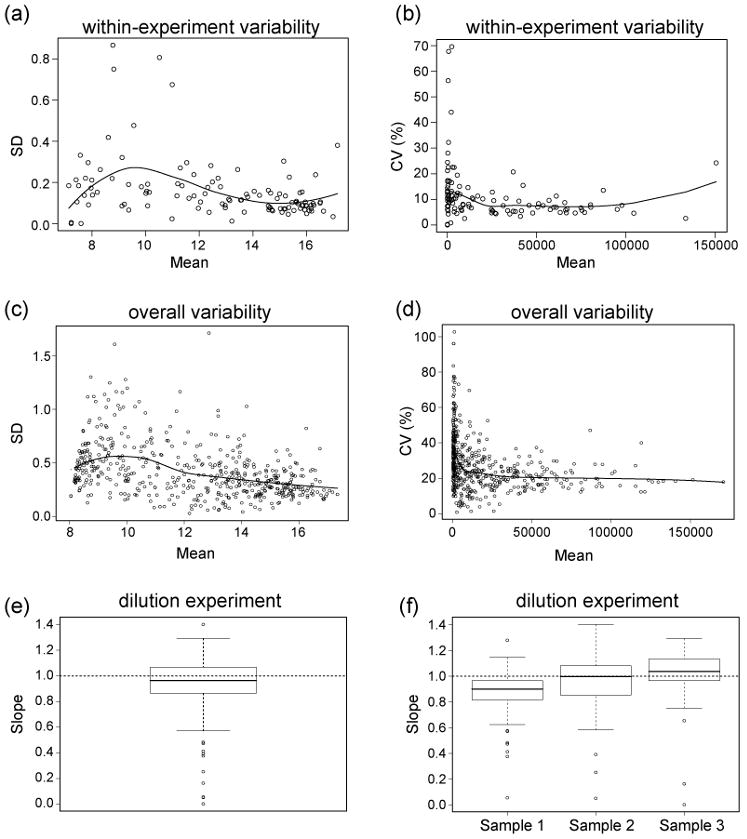
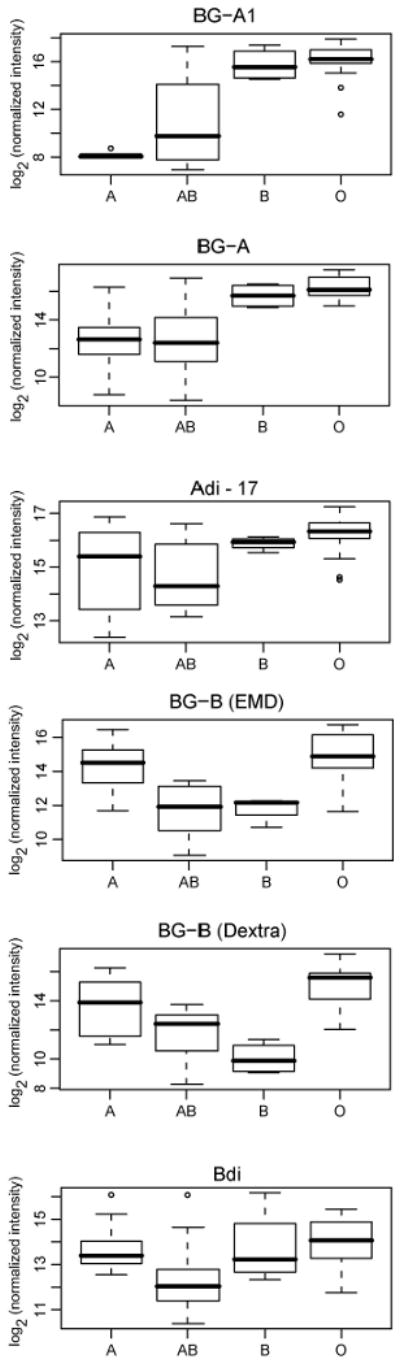
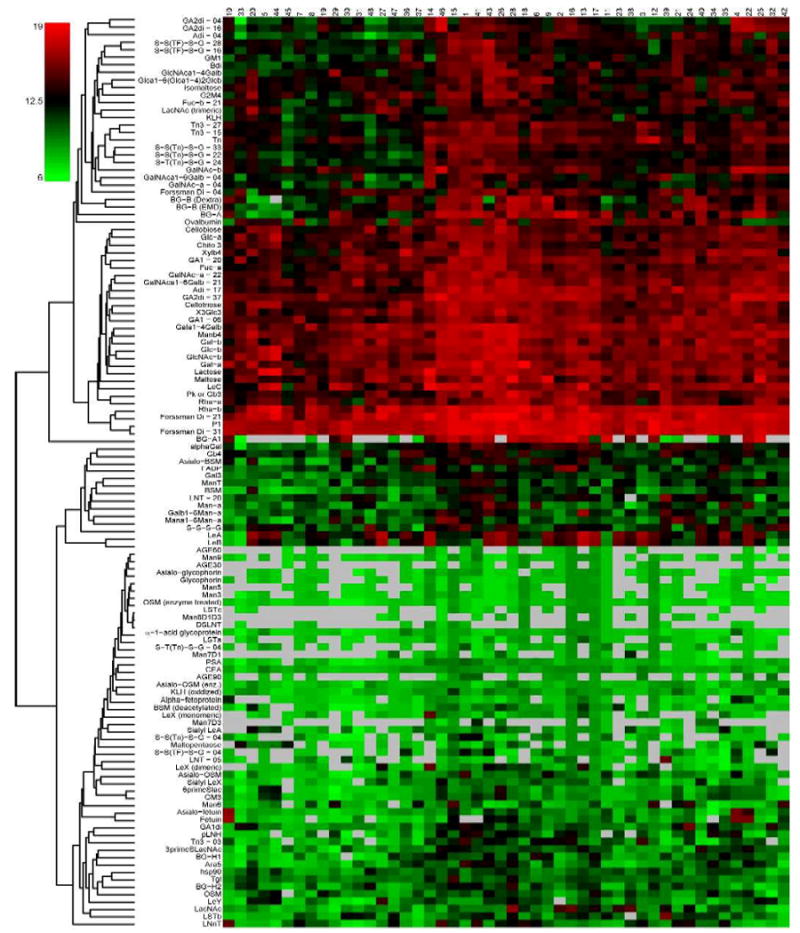
Carbohydrate antigen arrays (glycan arrays) have been recently developed for the high-throughput analysis of carbohydrate macromolecule interactions. When profiling serum, information about experimental variability, interindividual biological variability, and intraindividual temporal variability is critical. In this report, we describe the characterization of a carbohydrate antigen array and assay for profiling human serum. Through optimization of assay conditions and development of a normalization strategy, we obtain highly reproducible results with a within-experiment coefficient of variation (CV) of 10.8% and an overall CV (across multiple batches of slides and days) of 28.5%. We also report antibody profiles for 48 human subjects and evaluate for the first time the effects of age, race, sex, geographic location, and blood type on antibody profiles for a large set of carbohydrate antigens. We found significant dependence on age and blood type of antibody levels for a variety of carbohydrates. Finally, we conducted a longitudinal study with a separate group of 7 serum donors to evaluate the variation in anti-carbohydrate antibody levels within an individual over a period ranging from 3 to 13 weeks and found that, for nearly all antigens on our array, antibody levels are generally stable over this period. The results presented here provide the most comprehensive evaluation of experimental and biological variation reported to date for a glycan array and have significant implications for studies involving human serum profiling.
Figures
References
-
- Chen YT, Gure AO, Scanlan MJ. Serological analysis of expression cDNA libraries (SEREX): an immunoscreening technique for identifying immunogenic tumor antigens. Methods Mol Med. 2005;103:207–16. - PubMed
-
- Cekaite L, Hovig E, Sioud M. Protein arrays: a versatile toolbox for target identification and monitoring of patient immune responses. Methods Mol Biol. 2007;360:335–48. - PubMed
-
- Sioud M, Hansen M, Dybwad A. Profiling the immune responses in patient sera with peptide and cDNA display libraries. Int J Mol Med. 2000;6(2):123–128. - PubMed
-
- Gnjatic S, Wheeler C, Ebner M, Ritter E, Murray A, Altorki NK, Ferrara CA, Hepburne-Scott H, Joyce S, Koopman J, McAndrew MB, Workman N, Ritter G, Fallon R, Old LJ. Seromic analysis of antibody responses in non-small cell lung cancer patients and healthy donors using conformational protein arrays. J Immunol Methods. 2009;341(12):50–8. - PubMed
-
- Sundaresh S, Doolan DL, Hirst S, Mu Y, Unal B, Davies DH, Felgner PL, Baldi P. Identification of humoral immune responses in protein microarrays using DNA microarray data analysis techniques. Bioinformatics. 2006;22(14):1760–6. - PubMed
Publication types
MeSH terms
Substances
Grants and funding
LinkOut - more resources
Full Text Sources
Other Literature Sources
