. 2009 Oct;81(4):279-90.
doi: 10.1016/j.plefa.2009.05.025. Epub 2009 Jul 22.

The EP1 subtype of prostaglandin E2 receptor: role in keratinocyte differentiation and expression in non-melanoma skin cancer

Affiliations

The EP1 subtype of prostaglandin E2 receptor: role in keratinocyte differentiation and expression in non-melanoma skin cancer

R L Konger et al. Prostaglandins Leukot Essent Fatty Acids. 2009 Oct.

Abstract

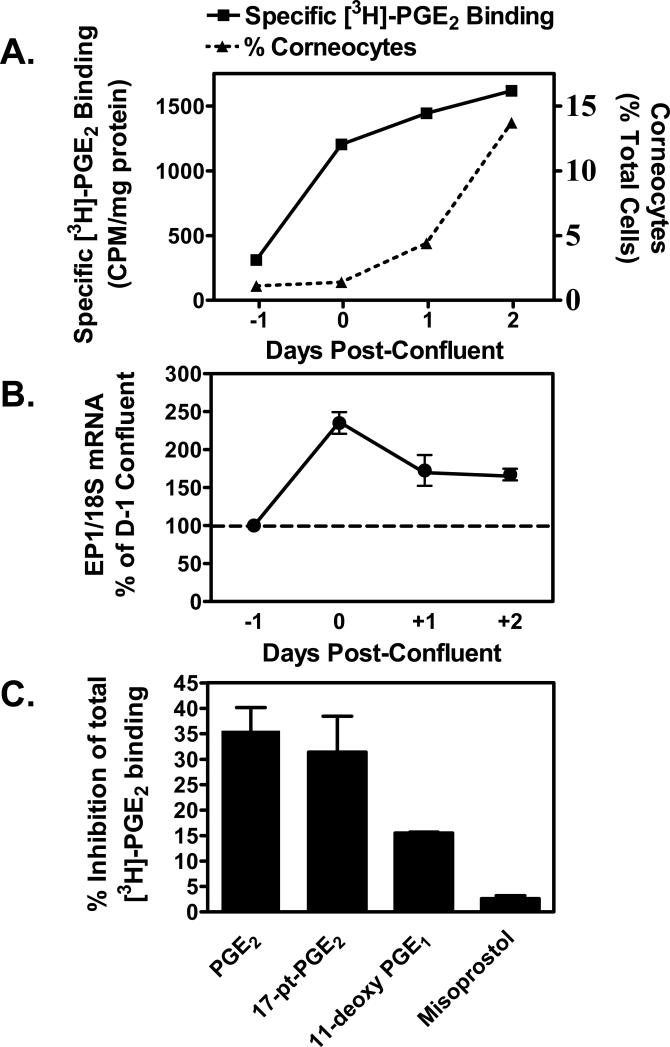
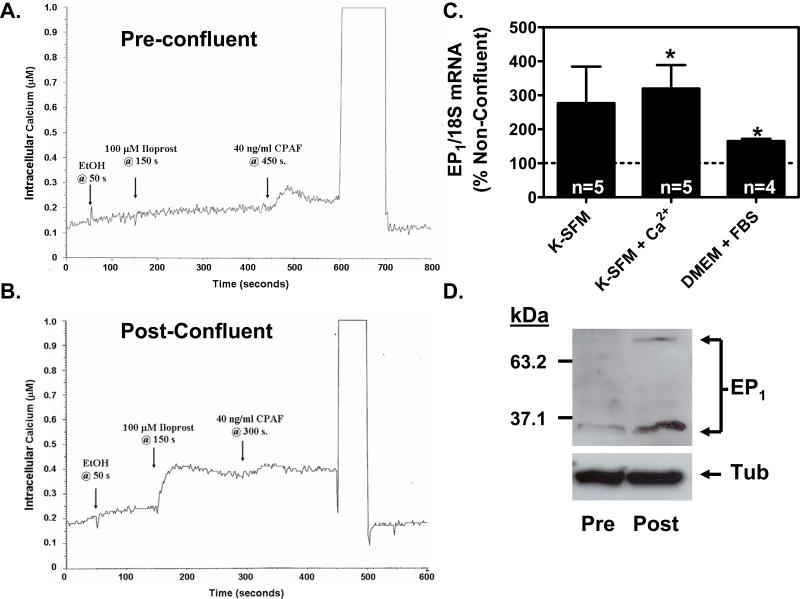
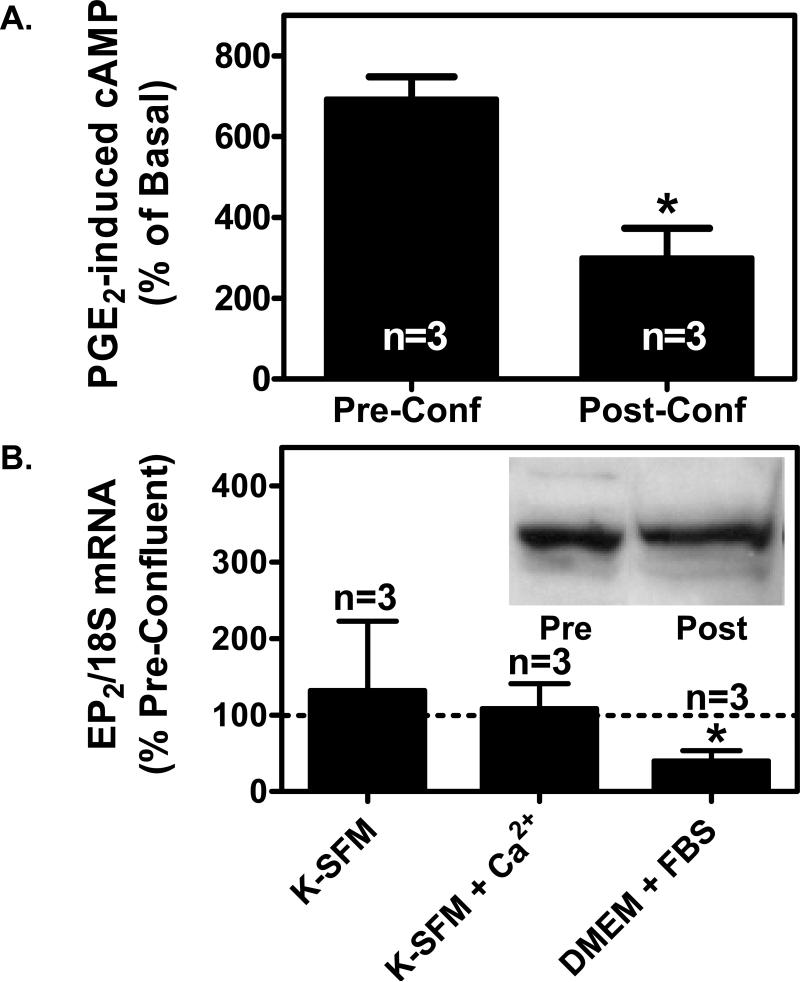
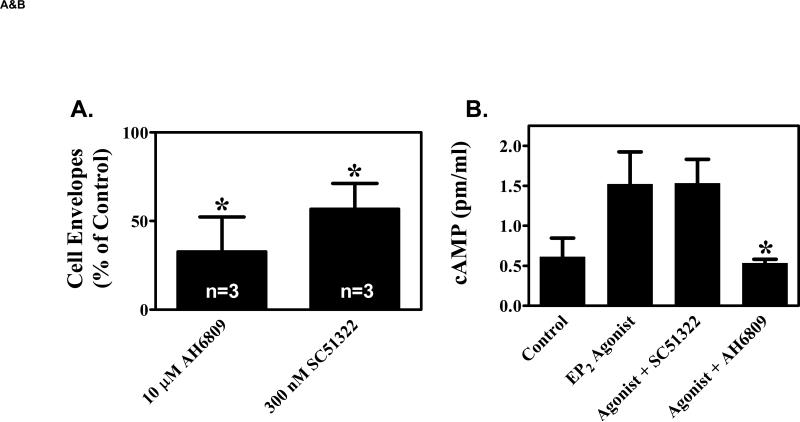
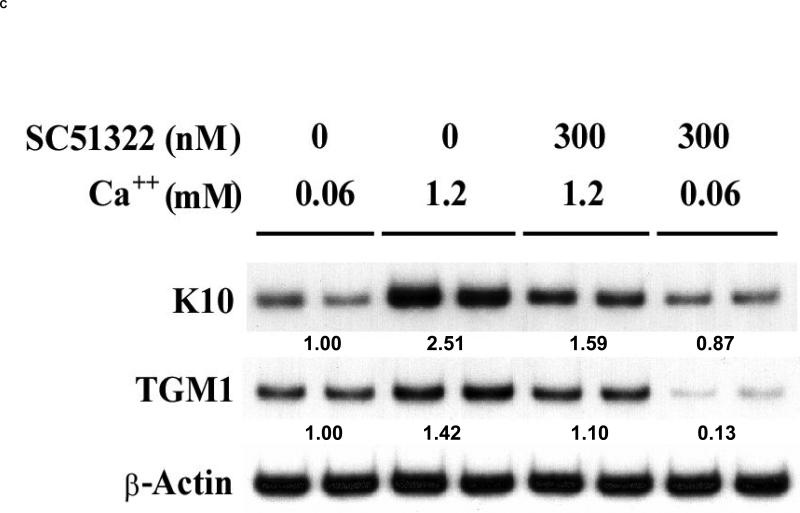
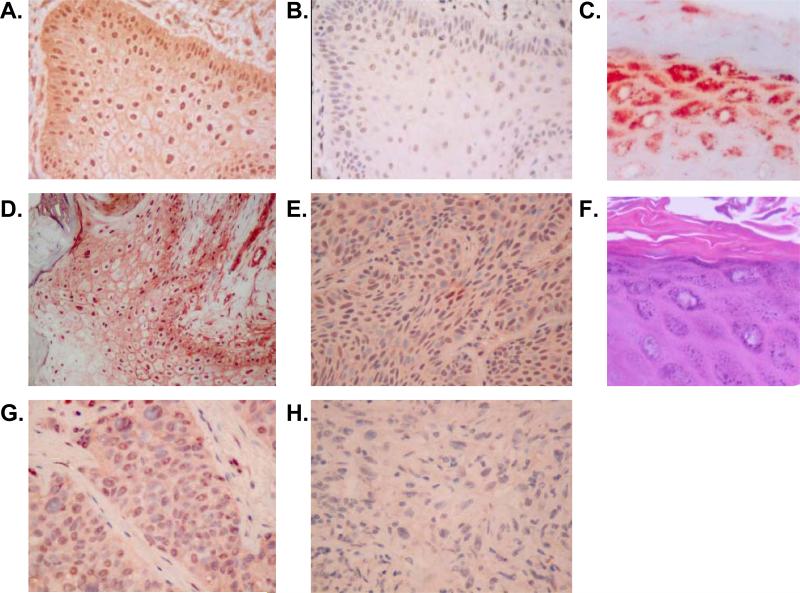
We have previously demonstrated that the EP1 subtype of PGE2 receptor is expressed in the differentiated compartment of normal human epidermis and is coupled to intracellular calcium mobilization. We therefore hypothesized that the EP1 receptor is coupled to keratinocyte differentiation. In in vitro studies, radioligand binding, RT-PCR, immunoblot and receptor agonist-induced second messenger studies demonstrate that the EP1 receptor is up-regulated by high cell density in human keratinocytes and this up-regulation precedes corneocyte formation. Moreover, two different EP1 receptor antagonists, SC51322 and AH6809, both inhibited corneocyte formation. SC51322 also inhibited the induction of differentiation-specific proteins, cytokeratin K10 and epidermal transglutaminase. We next examined the immunolocalization of the EP1 receptor in non-melanoma skin cancer in humans. Well-differentiated SCCs exhibited significantly greater membrane staining, while spindle cell carcinomas and BCCs had significantly decreased membrane staining compared with normal epidermis. This data supports a role for the EP1 receptor in regulating keratinocyte differentiation.


Figures

Figure 1
Figure 1. Up-regulation of the EP1 receptor occurs with high cell density and precedes the appearance of corneocytes in primary human keratinocytes (PHKs)
(A). Specific PGE2 binding activity is induced and precedes cornified envelope formation with increasing cell density. Freshly isolated primary human keratinocytes were plated onto collagen-coated 12-well plates in DMEM with 10% fetal bovine serum and antibiotics. One day prior to 100% confluence (day -1), and daily thereafter until the cells were 2 days post-confluent (Day +2), duplicate wells were incubated with [3H]-PGE2 in the presence or absence of a 1000-fold molar excess of unlabeled PGE2. Specific radiolabeled PGE2 binding was then determined and normalized to total cellular protein. On the same days, duplicate wells were trypsinized and terminally differentiated SDS-insoluble cornified cells were counted. Corneocytes are shown as a total cells present per well. (B). EP1 receptor mRNA is induced as PHKs acquire a confluent monolayer. PHKs were plated onto collagen-coated 6-well plates as described in panel A above. Starting one day prior to confluence, and daily thereafter through 2 days post-confluent, the cells were lysed and total RNA prepared for real-time PCR analysis of EP1 receptor expression. Results were normalized to 18S ribosomal RNA. The results represent the mean ± SEM of two experiments done in duplicate. (C). EP1 specific agonists compete for radiolabeled PGE2 binding in confluent PHKs. Two day post-confluent keratinocytes were treated with radiolabeled PGE2 as in panel A. Competition for radioligand binding is shown using 100-fold excess of unlabeled PGE2 and receptor agonists. Results shown are the mean and SEM of two experiments done in duplicate.
Figure 2
Figure 2. EP1 receptor signaling and expression are up-regulated in PHKs following the attainment of a confluent monolayer
(A & B). Agonist induced calcium mobilization is restricted to PHKs grown to a post-confluent monolayer. Cells at low cell density (pre-confluent) or high cell density (post-confluent) were loaded with the fluorescent calcium indicator, Fura PE3/AM. After trypsinization, the cells were stimulated with ethanol (EtOH), 100 μM iloprost in ethanol, or 40 ng/ml of the positive control platelet activating factor receptor (PAF-R) agonist, carbamyl-PAF (CPAF). (A). The EP1 receptor agonist, iloprost, is unable to induce measurable calcium mobilization in pre-confluent PHKs. In contrast, the positive control PAF-R agonist, CPAF, is shown to induce a calcium mobilization response. (B). The EP1 receptor agonist, iloprost, induces a robust calcium mobilization response in post-confluent keratinocytes. (C). EP1 receptor mRNA expression is up-regulated in post-confluent PHKs compared with pre-confluent PHKs under differing culture conditions. RNA was prepared from both pre-confluent and post-confluent cells and EP1 expression was assessed by quantitative real-time RT-PCR and normalized to 18S rRNA. Results represent the mean ± SEM for n=4-5 experiments done in duplicate; * p < 0.05, one-sample t-test relative to 100 % for pre-confluent controls. (D). EP1 receptor protein expression is up-regulated in post-confluent PHKs compared with pre-confluent PHKs. An immunoblot was performed on total cell lysates from pre-confluent PHKs and post-confluent PHKs grown in serum free media (K-SFM; 0.06 mM Ca2+). EP1 immunoreactive bands are seen at approximately 35 kDa and 70 kDa. The blot was stripped and reprobed with anti-α-tubulin antibody as a loading control (bottom panel).
Figure 3
Figure 3. Depending on the culture media, high cell density either has no effect on EP2 receptor expression or suppresses EP2 receptor expression in PHKs
(A). PGE2-induced cyclic AMP production is reduced in PHKs at high cell density. Pre-confluent PHKs or post-confluent PHKs cultured in DMEM + 10% FBS were treated with 3 μg/ml indomethacin overnight to block endogenous PGE2 formation. The cells were then stimulated with 100 nM PGE2 for 1 minute. Cyclic AMP was measured using a commercial EIA kit as described in the methods section. The results represent the mean and SEM of three experiments. (B). Quantitative real-time PCR was performed for EP2 receptor mRNA expression as described for the EP1 receptor in figure 2C above. Inset: Immunoblot for EP2 receptor expression in pre-confluent (Pre) and post-confluent (Post) PHKs grown in DMEM with 10% fetal bovine serum. Membrane preparations were produced from pre-confluent and 2 days post-confluent PHKs. In each case, 40 μg of the membrane preparation was separated by SDS-PAGE electrophoresis and immunoblot performed using a polyclonal anti-EP2 receptor antibody as described in the methods section.
Figure 4
Figure 4. EP1 receptor antagonists inhibit keratinocyte differentiation
(A). Primary human keratinocytes were grown in K-SFM (0.06 mM Ca2+). Addition of vehicle (0.1% DMSO), 10 μM of the non-specific EP1, EP2, EP3 receptor antagonist, AH6809, or 300 nM of the EP1 selective antagonist, SC51322 was begun when the cells were 50-60% confluent and every other day thereafter. At 3-4 days after reaching confluence, the capacity of the cells to form SDS-insoluble cornified cell envelopes was determined after trypsinizing the cells, pelleting the cells, and treating the cells for 3 hours with a calcium ionophore and high calcium media to stimulate envelope formation (envelope competence). The results were normalized to total cell counts and expressed as a percent of vehicle control cells. The results represent the mean and SEM of three experiments done in single or duplicate wells, with corneocytes from each well counted at least 10 times using a hemocytometer. * Results significantly different from control cells (P < 0.05; one sample t-test). (B). The non-specific EP1, EP2, EP3 antagonist (AH6809), but not the EP1 specific antagonist (SC51322), inhibits EP2 receptor stimulated cAMP production. Primary human keratinocytes were first incubated with 3 μg/ml indomethacin to block endogenous PGE2 formation. The cells were then stimulated with a highly selective EP2 receptor agonist (CAY10933, 10 nM) in the absence or presence of AH6809 (12.5 μM) and SC51322 (500 nM) for 15 minutes. Cyclic AMP was measured using a commercial EIA kit. (C). The EP1 specific agonist SC51322 inhibits calcium-dependent up-regulation of the differentiation specific markers, cytokeratin K10 and epidermal transglutaminase (TGMI). Duplicate wells of primary human keratinocytes were grown in K-SFM (0.06 mM Ca2+) until they reached near confluence (1 day prior to attaining confluence). At this time, the cells were treated with vehicle or 300 nM SC51322. One hour later, additional Ca2+ (1.2 mM), was added to the wells as indicated. After an additional 48 hours (1 day post-confluent), the cells were processed for isolation of total RNA. Semi-quantitative RT-PCR was then performed on each of the duplicate samples using specific primers for K10, TGM1, or β-actin (loading control). All PCR reactions were stopped during the exponential phase of PCR amplification and visualized by agarose gel electrophoresis and autoradiography. The mean normalized band intensity for both K10 and TGM1 (normalized to β-Actin) is shown under each duplicate radiographic image. In each case, the band intensity is shown as a ratio compared with the low calcium (0.06 mM) vehicle control cells (assigned a value of 1.00). Band intensity was determined by area integration using NIH Image J software.
Figure 5
Figure 5. EP1 receptor immunolocalization in non-melanoma skin cancer
Immunohisochemical (IHC) analyis of EP1 receptor expression was performed on formalin-fixed, paraffin-embedded archival tissue samples. In each case, 5 μm sections were deparaffinized and heat-induced epitope retrieval was done as outlined in the methods section. IHC staining was done using a monoclonal anti-human EP1 receptor antibody (clone 5F12) (A, C-F) or an isotype control (B). (A). Keratoacanthoma (400x magnification). (B). A serial section of the same keratoacanthoma stained with isotype (IgG2bκ) negative control antibody (400x). (C). Hyperplastic skin overlying the basal cell carcinoma seen in panel E. (D). Well-differentiated squamous cell carcinoma (SCC) (200x). (E). Basal cell carcinoma (400x). (F). Hematoxylin & eosin stained section corresponding to the section seen in panel C. (G). Poorly-differentiated SCC (400x). (H). Spindle cell carcinoma (400x).

Similar articles

Cited by

References

    1. Jakobsson PJ, Thoren S, Morgenstern R, Samuelsson B. Identification of human prostaglandin E synthase: a microsomal, glutathione-dependent, inducible enzyme, constituting a potential novel drug target. Proc Natl Acad Sci USA. 1999;96:7220–5. - PMC - PubMed
    1. Pentland AP, Needleman P. Modulation of keratinocyte proliferation in vitro by endogenous prostaglandin synthesis. J Clin Invest. 1986;77:246–51. - PMC - PubMed
    1. Breyer RM, Bagdassarian CK, Myers SA, Breyer MD. Prostanoid receptors: subtypes and signaling. Annual Rev Pharmacol Toxicol. 2001;41:661–90. - PubMed
    1. Hatae N, Sugimoto Y, Ichikawa A. Prostaglandin Receptors: Advances in the study of EP3 receptor signaling. J. Biochem. 2002;131:781–784. - PubMed
    1. Abramovitz M, Adam M, Boie Y, et al. The utilization of recombinant prostanoid receptors to determine the affinities and selectivities of prostaglandins and related analogs. Biochim Biophys Acta. 2000;1483:285–293. - PubMed

MeSH terms