

Brain-derived neurotrophic factor enhances the basal rate of protein synthesis by increasing active eukaryotic elongation factor 2 levels and promoting translation elongation in cortical neurons
- PMID: 19625250
- PMCID: PMC2785322
- DOI: 10.1074/jbc.M109.023010
Brain-derived neurotrophic factor enhances the basal rate of protein synthesis by increasing active eukaryotic elongation factor 2 levels and promoting translation elongation in cortical neurons
Abstract
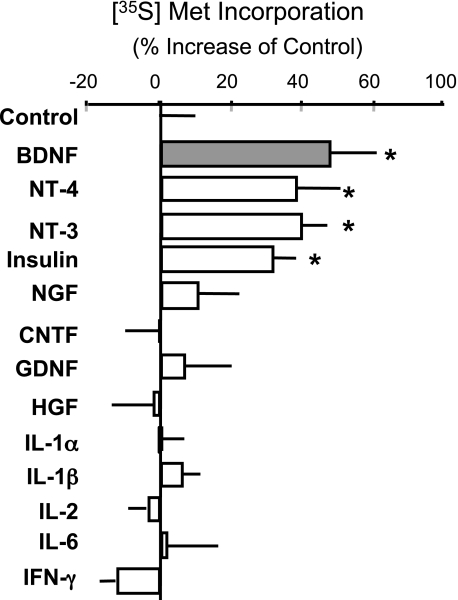
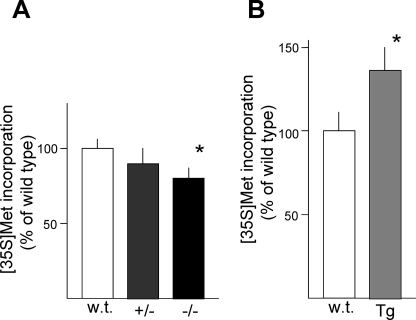
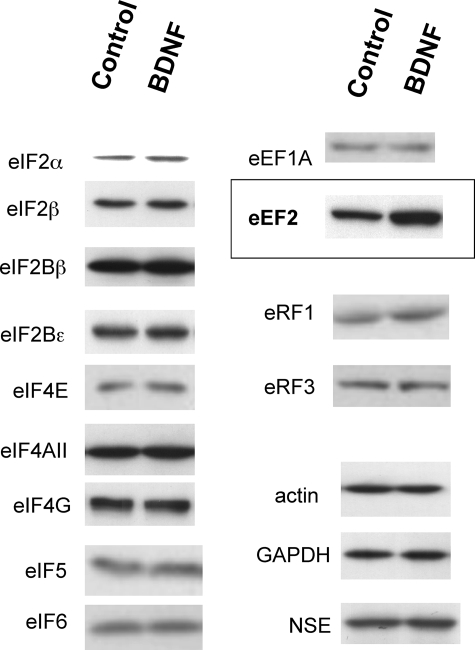
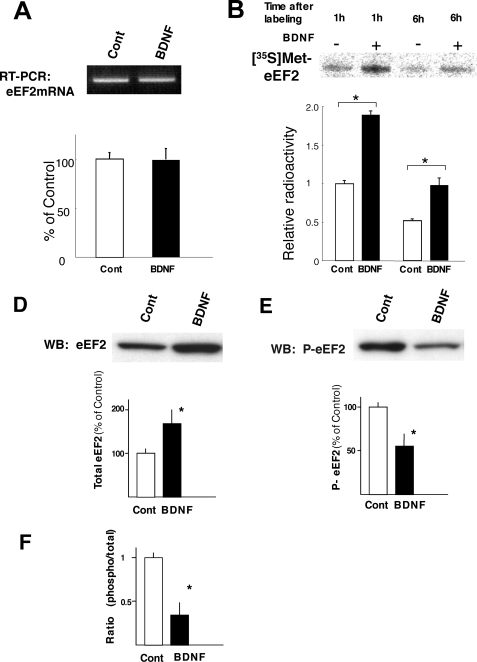
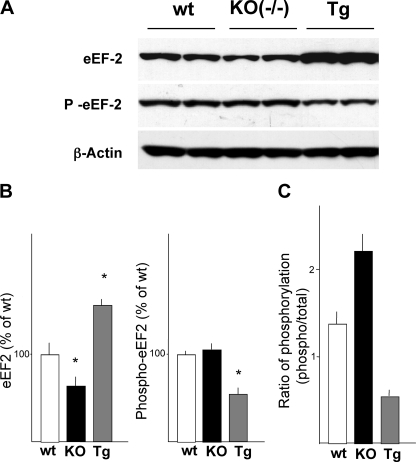
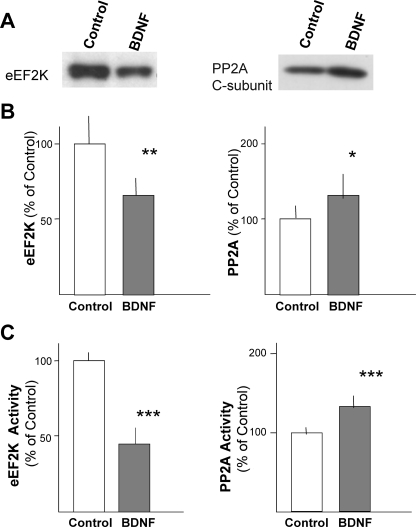
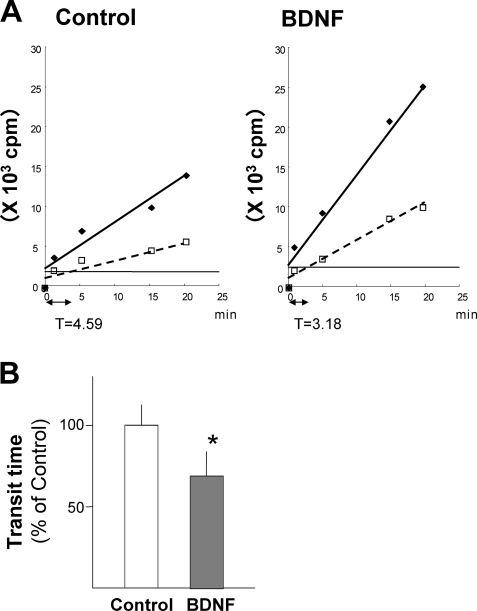
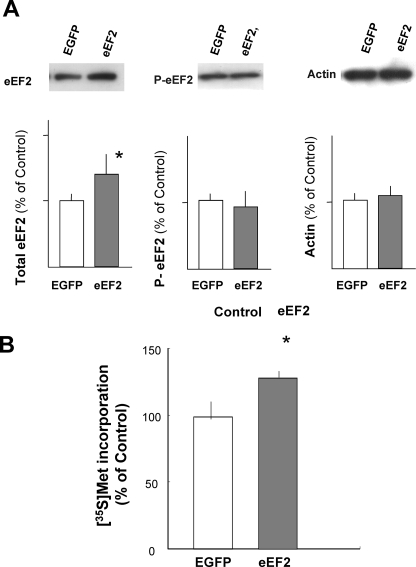
The constitutive and activity-dependent components of protein synthesis are both critical for neural function. Although the mechanisms controlling extracellularly induced protein synthesis are becoming clear, less is understood about the molecular networks that regulate the basal translation rate. Here we describe the effects of chronic treatment with various neurotrophic factors and cytokines on the basal rate of protein synthesis in primary cortical neurons. Among the examined factors, brain-derived neurotrophic factor (BDNF) showed the strongest effect. The rate of protein synthesis increased in the cortical tissues of BDNF transgenic mice, whereas it decreased in BDNF knock-out mice. BDNF specifically increased the level of the active, unphosphorylated form of eukaryotic elongation factor 2 (eEF2). The levels of active eEF2 increased and decreased in BDNF transgenic and BDNF knock-out mice, respectively. BDNF decreased kinase activity and increased phosphatase activity against eEF2 in vitro. Additionally, BDNF shortened the ribosomal transit time, an index of translation elongation. In agreement with these results, overexpression of eEF2 enhanced protein synthesis. Taken together, our results demonstrate that the increased level of active eEF2 induced by chronic BDNF stimulation enhances translational elongation processes and increases the total rate of protein synthesis in neurons.
Figures
Similar articles
-
Enhancement of translation elongation in neurons by brain-derived neurotrophic factor: implications for mammalian target of rapamycin signaling.J Neurochem. 2005 Dec;95(5):1438-45. doi: 10.1111/j.1471-4159.2005.03466.x. Epub 2005 Sep 20. J Neurochem. 2005. PMID: 16171514
-
Dual regulation of translation initiation and peptide chain elongation during BDNF-induced LTP in vivo: evidence for compartment-specific translation control.J Neurochem. 2006 Dec;99(5):1328-37. doi: 10.1111/j.1471-4159.2006.04158.x. Epub 2006 Oct 25. J Neurochem. 2006. PMID: 17064361
-
Amyloid-beta interrupts the PI3K-Akt-mTOR signaling pathway that could be involved in brain-derived neurotrophic factor-induced Arc expression in rat cortical neurons.J Neurosci Res. 2009 Aug 1;87(10):2297-307. doi: 10.1002/jnr.22057. J Neurosci Res. 2009. PMID: 19301428
-
Eukaryotic elongation factor-2 (eEF2): its regulation and peptide chain elongation.Cell Biochem Funct. 2011 Apr;29(3):227-34. doi: 10.1002/cbf.1740. Epub 2011 Mar 10. Cell Biochem Funct. 2011. PMID: 21394738 Review.
-
The role of eEF2 pathway in learning and synaptic plasticity.Neurobiol Learn Mem. 2013 Oct;105:100-6. doi: 10.1016/j.nlm.2013.04.015. Epub 2013 Jun 3. Neurobiol Learn Mem. 2013. PMID: 23742918 Review.
Cited by
-
ErbB inhibitors ameliorate behavioral impairments of an animal model for schizophrenia: implication of their dopamine-modulatory actions.Transl Psychiatry. 2013 Apr 30;3(4):e252. doi: 10.1038/tp.2013.29. Transl Psychiatry. 2013. PMID: 23632456 Free PMC article.
-
BDNF stimulation of protein synthesis in cortical neurons requires the MAP kinase-interacting kinase MNK1.J Neurosci. 2015 Jan 21;35(3):972-84. doi: 10.1523/JNEUROSCI.2641-14.2015. J Neurosci. 2015. PMID: 25609615 Free PMC article.
-
Dynamics of elongation factor 2 kinase regulation in cortical neurons in response to synaptic activity.J Neurosci. 2015 Feb 18;35(7):3034-47. doi: 10.1523/JNEUROSCI.2866-14.2015. J Neurosci. 2015. PMID: 25698741 Free PMC article.
-
Fluoxetine regulates eEF2 activity (phosphorylation) via HDAC1 inhibitory mechanism in an LPS-induced mouse model of depression.J Neuroinflammation. 2021 Feb 1;18(1):38. doi: 10.1186/s12974-021-02091-5. J Neuroinflammation. 2021. PMID: 33526073 Free PMC article.
-
New perspectives on the involvement of mTOR in depression as well as in the action of antidepressant drugs.Br J Clin Pharmacol. 2016 Nov;82(5):1280-1290. doi: 10.1111/bcp.12845. Epub 2016 Jan 8. Br J Clin Pharmacol. 2016. PMID: 26613210 Free PMC article. Review.
References
Publication types
MeSH terms
Substances
LinkOut - more resources
Full Text Sources
Molecular Biology Databases
Miscellaneous
