

Virus assembly occurs following a pH- or Ca2+-triggered switch in the thermodynamic attraction between structural protein capsomeres
- PMID: 19625304
- PMCID: PMC2842788
- DOI: 10.1098/rsif.2009.0175
Virus assembly occurs following a pH- or Ca2+-triggered switch in the thermodynamic attraction between structural protein capsomeres
Abstract
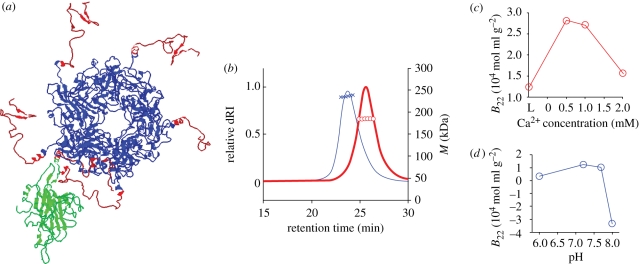
Viral self-assembly is of tremendous virological and biomedical importance. Although theoretical and crystallographic considerations suggest that controlled conformational change is a fundamental regulatory mechanism in viral assembly, direct proof that switching alters the thermodynamic attraction of self-assembling components has not been provided. Using the VP1 protein of polyomavirus, we report a new method to quantitatively measure molecular interactions under conditions of rapid protein self-assembly. We show, for the first time, that triggering virus capsid assembly through biologically relevant changes in Ca(2+) concentration, or pH, is associated with a dramatic increase in the strength of protein molecular attraction as quantified by the second virial coefficient (B(22)). B(22) decreases from -2.3 x 10(-4) mol ml g(-2) (weak protein-protein attraction) to -2.4 x 10(-3) mol ml g(-2) (strong protein attraction) for metastable and Ca(2+)-triggered self-assembling capsomeres, respectively. An assembly-deficient mutant (VP1CDelta63) is conversely characterized by weak protein-protein repulsion independently of chemical change sufficient to cause VP1 assembly. Concomitant switching of both VP1 assembly and thermodynamic attraction was also achieved by in vitro changes in ammonium sulphate concentration, consistent with protein salting-out behaviour. The methods and findings reported here provide new insight into viral assembly, potentially facilitating the development of new antivirals and vaccines, and will open the way to a more fundamental physico-chemical description of complex protein self-assembly systems.
Figures


Similar articles
-
Possible role for cellular karyopherins in regulating polyomavirus and papillomavirus capsid assembly.J Virol. 2008 Oct;82(20):9848-57. doi: 10.1128/JVI.01221-08. Epub 2008 Aug 13. J Virol. 2008. PMID: 18701594 Free PMC article.
-
Chaperone-mediated in vitro assembly of Polyomavirus capsids.Proc Natl Acad Sci U S A. 2003 Sep 2;100(18):10477-82. doi: 10.1073/pnas.1832245100. Epub 2003 Aug 19. Proc Natl Acad Sci U S A. 2003. PMID: 12928495 Free PMC article.
-
Mechanism of assembly of recombinant murine polyomavirus-like particles.J Virol. 2000 Feb;74(4):1658-62. doi: 10.1128/jvi.74.4.1658-1662.2000. J Virol. 2000. PMID: 10644335 Free PMC article.
-
Uncoating of non-enveloped viruses.Curr Opin Virol. 2013 Feb;3(1):27-33. doi: 10.1016/j.coviro.2012.12.004. Epub 2013 Jan 16. Curr Opin Virol. 2013. PMID: 23332135 Review.
-
Cryo-electron microscopy for the study of virus assembly.Nat Chem Biol. 2020 Mar;16(3):231-239. doi: 10.1038/s41589-020-0477-1. Epub 2020 Feb 20. Nat Chem Biol. 2020. PMID: 32080621 Review.
Cited by
-
Adenovirus Dodecahedron, a VLP, Can be Purified by Size Exclusion Chromatography Instead of Time-Consuming Sucrose Density Gradient Centrifugation.Mol Biotechnol. 2015 Jun;57(6):565-73. doi: 10.1007/s12033-015-9850-9. Mol Biotechnol. 2015. PMID: 25711740
-
Insulin analogs for the treatment of diabetes mellitus: therapeutic applications of protein engineering.Ann N Y Acad Sci. 2011 Dec;1243:E40-E54. doi: 10.1111/j.1749-6632.2012.06468.x. Epub 2012 Mar 13. Ann N Y Acad Sci. 2011. PMID: 22641195 Free PMC article.
-
Field-Flow Fractionation in Molecular Biology and Biotechnology.Molecules. 2023 Aug 23;28(17):6201. doi: 10.3390/molecules28176201. Molecules. 2023. PMID: 37687030 Free PMC article. Review.
-
Asymmetrical Flow Field-Flow Fractionation on Virus and Virus-Like Particle Applications.Microorganisms. 2019 Nov 12;7(11):555. doi: 10.3390/microorganisms7110555. Microorganisms. 2019. PMID: 31726671 Free PMC article. Review.
-
Prion-like Domains in Eukaryotic Viruses.Sci Rep. 2018 Jun 12;8(1):8931. doi: 10.1038/s41598-018-27256-w. Sci Rep. 2018. PMID: 29895872 Free PMC article.
References
-
- Alber T., Hartman F. C., Johnson R. M., Petsko G. A., Tsernoglou D. 1981. Crystallization of yeast triose phosphate isomerase from polyethylene-glycol: protein crystal-formation following phase-separation. J. Biol. Chem. 256, 1356–1361. - PubMed
-
- Alberts B. 2008. Molecular biology of the cell, 5th edn, pp. 3–190. New York, NY: Garland Science.
Publication types
MeSH terms
Substances
LinkOut - more resources
Full Text Sources
Other Literature Sources
Miscellaneous
