Induction of suppressors of cytokine signaling by the trichothecene deoxynivalenol in the mouse
- PMID: 19625342
- PMCID: PMC2766768
- DOI: 10.1093/toxsci/kfp150
Induction of suppressors of cytokine signaling by the trichothecene deoxynivalenol in the mouse
Abstract
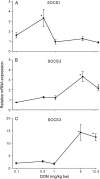
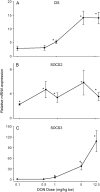
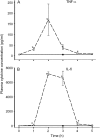
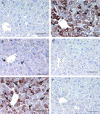
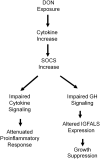
Deoxynivalenol (DON), a trichothecene mycotoxin found in grains and cereal-based foods worldwide, impairs weight gain in experimental animals but the underlying mechanisms remain undetermined. Oral exposure to DON induces rapid and transient upregulation of proinflammatory cytokine expression in the mouse. The latter are known to induce several suppressors of cytokine signaling (SOCS), some of which impair growth hormone (GH) signaling. We hypothesized that oral exposure to DON will induce SOCS expression in the mouse. Real-time PCR and cytokine bead array revealed that oral gavage with DON rapidly (1 h) induced tumor necrosis factor-alpha and interleukin-6 mRNA and protein expression in several organs and plasma, respectively. Upregulation of mRNAs for four well-characterized SOCS (CIS [cytokine-inducible SH2 domain protein], SOCS1, SOCS2, and SOCS3) was either concurrent with (1 h) or subsequent to cytokine upregulation (2 h). Notably, DON-induced SOCS3 mRNAs in muscle, spleen and liver, with CIS1, SOCS1, and SOCS2 occurring to a lesser extent. Hepatic SOCS3 mRNA was a very sensitive indicator of DON exposure with SOCS3 protein being detectable in the liver well after the onset of cytokine decline (5 h). Furthermore, hepatic SOCS upregulation was associated with about 75% suppression of GH-inducible insulin-like growth factor acid labile subunit. Taken together, DON-induced cytokine upregulation corresponded to increased expression of several SOCS, and was associated with suppression of GH-inducible gene expression in the liver.
Figures





Comment in
-
A new perspective on deoxynivalenol and growth suppression.Toxicol Sci. 2010 Feb;113(2):281-3. doi: 10.1093/toxsci/kfp287. Epub 2009 Nov 23. Toxicol Sci. 2010. PMID: 19933702 No abstract available.
Similar articles
-
Suppression of insulin-like growth factor acid-labile subunit expression--a novel mechanism for deoxynivalenol-induced growth retardation.Toxicol Sci. 2010 Feb;113(2):412-21. doi: 10.1093/toxsci/kfp225. Epub 2009 Oct 4. Toxicol Sci. 2010. PMID: 19805407 Free PMC article.
-
Interleukin-6 inhibits hepatic growth hormone signaling via upregulation of Cis and Socs-3.Am J Physiol Gastrointest Liver Physiol. 2003 Apr;284(4):G646-54. doi: 10.1152/ajpgi.00178.2002. Epub 2003 Jan 2. Am J Physiol Gastrointest Liver Physiol. 2003. PMID: 12519742
-
Tissue distribution and proinflammatory cytokine induction by the trichothecene deoxynivalenol in the mouse: comparison of nasal vs. oral exposure.Toxicology. 2008 Jun 3;248(1):39-44. doi: 10.1016/j.tox.2008.03.005. Epub 2008 Mar 14. Toxicology. 2008. PMID: 18433975
-
SOCS proteins: negative regulators of cytokine signaling.Stem Cells. 2001;19(5):378-87. doi: 10.1634/stemcells.19-5-378. Stem Cells. 2001. PMID: 11553846 Review.
-
Suppressors of Cytokine Signaling and Hepatocellular Carcinoma.Cancers (Basel). 2022 May 22;14(10):2549. doi: 10.3390/cancers14102549. Cancers (Basel). 2022. PMID: 35626153 Free PMC article. Review.
Cited by
-
Evaluation of insulin-like growth factor acid-labile subunit as a potential biomarker of effect for deoxynivalenol-induced proinflammatory cytokine expression.Toxicology. 2013 Feb 8;304:192-8. doi: 10.1016/j.tox.2012.12.017. Epub 2013 Jan 5. Toxicology. 2013. PMID: 23298694 Free PMC article.
-
Acute and subacute oral administration of mycotoxin deoxynivalenol exacerbates the pro-inflammatory and pro-pruritic responses in a mouse model of allergic dermatitis.Arch Toxicol. 2020 Dec;94(12):4197-4207. doi: 10.1007/s00204-020-02875-3. Epub 2020 Aug 19. Arch Toxicol. 2020. PMID: 32813090
-
The Putative Role of Viruses, Bacteria, and Chronic Fungal Biotoxin Exposure in the Genesis of Intractable Fatigue Accompanied by Cognitive and Physical Disability.Mol Neurobiol. 2016 May;53(4):2550-71. doi: 10.1007/s12035-015-9262-7. Epub 2015 Jun 17. Mol Neurobiol. 2016. PMID: 26081141 Review.
-
Growth performance, serum biochemical profile, jejunal morphology, and the expression of nutrients transporter genes in deoxynivalenol (DON)- challenged growing pigs.BMC Vet Res. 2015 Jul 3;11:144. doi: 10.1186/s12917-015-0449-y. BMC Vet Res. 2015. PMID: 26138080 Free PMC article.
-
Effects of Chronic Exposure to Diets Containing Moldy Corn or Moldy Wheat Bran on Growth Performance, Ovarian Follicular Pool, and Oxidative Status of Gilts.Toxins (Basel). 2022 Jun 17;14(6):413. doi: 10.3390/toxins14060413. Toxins (Basel). 2022. PMID: 35737074 Free PMC article.
References
-
- Ahmed TA, Buzzelli MD, Lang CH, Capen JB, Shumate ML, Navaratnarajah M, Nagarajan M, Cooney RN. Interleukin-6 (IL-6) inhibits growth hormone (GH) mediated gene expression in hepatocytes. Am. J. Physiol Gastrointest. Liver Physiol. 2007;292:G1793–G1803. - PubMed
-
- Alexander WS. Suppressors of cytokine signalling (SOCS) in the immune system. Nat. Rev. Immunol. 2002;2:410–416. - PubMed
-
- Amuzie CJ, Harkema JR, Pestka JJ. Tissue distribution and proinflammatory cytokine induction by the trichothecene deoxynivalenol in the mouse: Comparison of nasal vs. oral exposure. Toxicology. 2008;248:39–44. - PubMed
-
- Azcona-Olivera JI, Ouyang YL, Warner RL, Linz JE, Pestka JJ. Effects of vomitoxin (deoxynivalenol) and cycloheximide on IL-2, 4, 5 and 6 secretion and mRNA levels in murine CD4+ cells. Food Chem. Toxicol. 1995;33:433–441. - PubMed

