

Real-time measurement of renal blood flow in healthy subjects using contrast-enhanced ultrasound
- PMID: 19625375
- PMCID: PMC2775574
- DOI: 10.1152/ajprenal.00172.2009
Real-time measurement of renal blood flow in healthy subjects using contrast-enhanced ultrasound
Abstract
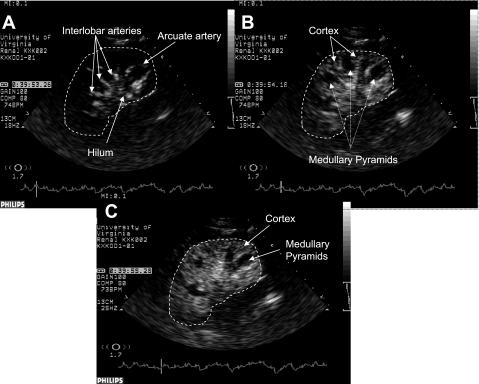
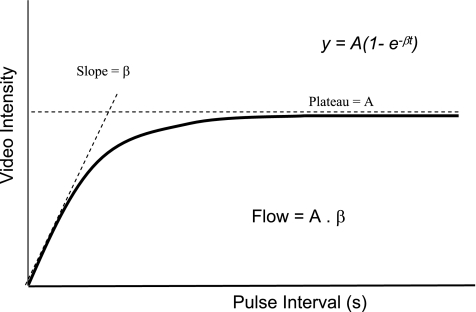
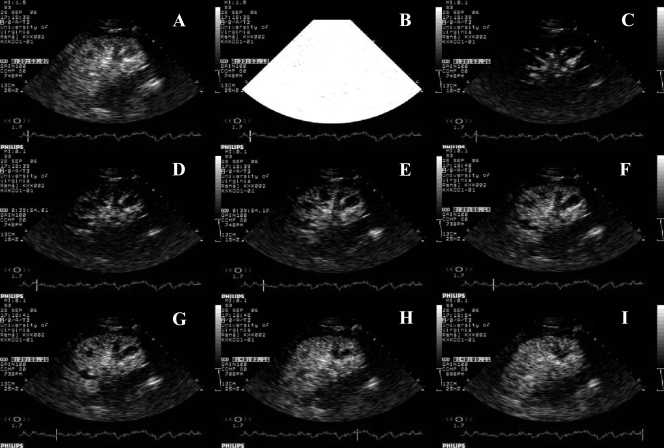
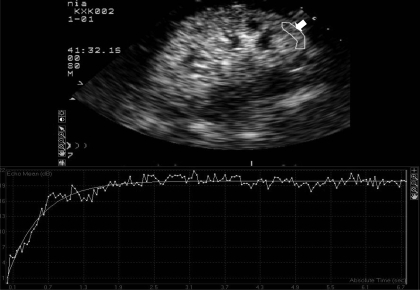
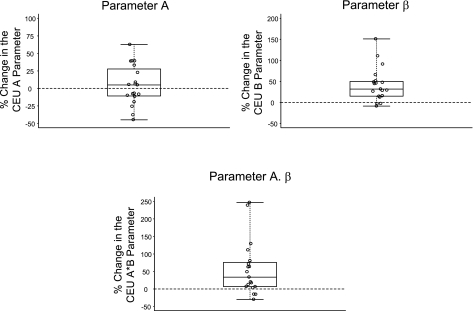
Current methods for measuring renal blood flow (RBF) are time consuming and not widely available. Contrast-enhanced ultrasound (CEU) is a safe and noninvasive imaging technique suitable for assessment of tissue blood flow, which has been used clinically to assess myocardial blood flow. We tested the utility of CEU in monitoring changes in RBF in healthy volunteers. We utilized CEU to monitor the expected increase in RBF following a high protein meal in healthy adults. Renal cortical perfusion was assessed by CEU using low mechanical index (MI) power modulation Angio during continuous infusions of Definity. Following destruction of tissue microbubbles using ultrasound at a MI of 1.0, the rate of tissue replenishment with microbubbles and the plateau acoustic intensity (AI) were used to estimate the RBF velocity and cortical blood volume, respectively. Healthy adults (n = 19, mean age 26.6 yr) were enrolled. The A.beta parameter of CEU, representing mean RBF increased by 42.8%from a baseline of 17.05 +/- 6.23 to 23.60 +/- 6.76 dB/s 2 h after the ingestion of the high-protein meal (P = 0.002). Similarly, there was a 37.3%increase in the beta parameter, representing the geometric mean of blood velocity after the high protein meal (P < 0.001). The change in cortical blood volume was not significant (P = 0.89). Infusion time of Definity was 6.3 +/- 2.0 min. The ultrasound contrast agent was tolerated well with no serious adverse events. CEU is a fast, noninvasive, and practical imaging technique that may be useful for monitoring renal blood velocity, volume, and flow.
Figures
References
-
- Aukland K. Methods for measuring renal blood flow: total flow and regional distribution. Annu Rev Physiol 42: 543–555, 1980 - PubMed
-
- Balcells E, Powers ER, Lepper W, Belcik T, Wei K, Ragosta M, Samady H, Lindner JR. Detection of myocardial viability by contrast echocardiography in acute infarction predicts recovery of resting function and contractile reserve. J Am Coll Cardiol 41: 827–833, 2003 - PubMed
-
- Bednarik JA, May CN. Evaluation of a transit-time system for the chronic measurement of blood flow in conscious sheep. J Appl Physiol 78: 524–530, 1995 - PubMed
-
- Di Giantomasso D, May CN, Bellomo R. Vital organ blood flow during hyperdynamic sepsis. Chest 124: 1053–1059, 2003 - PubMed
-
- Hosotani Y, Takahashi N, Kiyomoto H, Ohmori K, Hitomi H, Fujioka H, Aki Y, Fukunaga M, Yuasa S, Mizushige K, Kohno M. A new method for evaluation of split renal cortical blood flow with contrast echography. Hypertens Res 25: 77–83, 2002 - PubMed
Publication types
MeSH terms
Substances
Grants and funding
LinkOut - more resources
Full Text Sources
Other Literature Sources
Miscellaneous