. 2009 Oct;83(19):9652-62.
doi: 10.1128/JVI.00867-09. Epub 2009 Jul 22.

The size of the viral inoculum contributes to the outcome of hepatitis B virus infection

Affiliations

The size of the viral inoculum contributes to the outcome of hepatitis B virus infection

Shinichi Asabe et al. J Virol. 2009 Oct.

Abstract

The impact of virus dose on the outcome of infection is poorly understood. In this study we show that, for hepatitis B virus (HBV), the size of the inoculum contributes to the kinetics of viral spread and immunological priming, which then determine the outcome of infection. Adult chimpanzees were infected with a serially diluted monoclonal HBV inoculum. Unexpectedly, despite vastly different viral kinetics, both high-dose inocula (10(10) genome equivalents [GE] per animal) and low-dose inocula (10 degrees GE per animal) primed the CD4 T-cell response after logarithmic spread was detectable, allowing infection of 100% of hepatocytes and requiring prolonged immunopathology before clearance occurred. In contrast, intermediate (10(7) and 10(4) GE) inocula primed the T-cell response before detectable logarithmic spread and were abruptly terminated with minimal immunopathology before 0.1% of hepatocytes were infected. Surprisingly, a dosage of 10(1) GE primed the T-cell response after all hepatocytes were infected and caused either prolonged or persistent infection with severe immunopathology. Finally, CD4 T-cell depletion before inoculation of a normally rapidly controlled inoculum precluded T-cell priming and caused persistent infection with minimal immunopathology. These results suggest that the relationship between the kinetics of viral spread and CD4 T-cell priming determines the outcome of HBV infection.


Figures

FIG. 1.
FIG. 1.
Course of acute HBV infection in chimpanzees after experimental intravenous inoculation of various doses of HBV indicated as GE of HBV in parentheses next to the chimpanzee identification number. Serum HBV DNA levels were determined by quantitative real-time PCR and are shown as GE/ml. sALT activity (yellow shaded area) is shown as units/liter. Horizontal bars represent serum HBe and HBs antigen levels and the open horizontal bars represent the presence of anti-HBc, anti-HBe, and anti-HBs antibodies. The amount of each protein is reflected by the thickness of each bar as indicated in the legend. The sex, age, and body weight at the inoculation time of each animal is shown in Table S1 in the supplemental material. The superscript “a” indicates the percentage of HBc antigen-positive hepatocytes determined by immunohistochemical analysis of paraffin-embedded liver biopsy tissue.
FIG. 2.
FIG. 2.
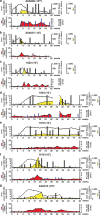
Peripheral CD4+ T-cell responses against HBV core protein and intrahepatic CD8+ T-cell responses. The upper panel in each figure represents the serum HBV DNA as a black line and sALT as a yellow shaded area, and the results of peripheral CD4+ T-cell ELSIPOT assays are overlaid as black bars. Cryopreserved PBMC were thawed and stimulated in vitro with HBV core protein, and the numbers of IFN-γ producing cells were determined by an ELISPOT assay. The data are shown as number of spots at each time point minus the number of spots before inoculation per million PBMC. The lower panel shows the total number of intrahepatic HBV-specific CD8+ T cells per 102 total CD8+ T cells as filled blue bars (right axis) and the fold induction of intrahepatic CD8 mRNA compared to two preinoculation time points as a shaded red area (left axis). Intrahepatic lymphocytes were expanded antigen nonspecifically in vitro and tested with all of the corresponding Patr/peptide multimer complexes shown in Table S5 in the supplemental material. Frequencies of CD8+ T cells for each Patr/peptide multimer are shown in Table S3 in the supplemental material (a to f). nt, Not tested. *, Tested and negative.
FIG. 3.
FIG. 3.
Intrahepatic mRNA induction profiles in infected animals. The first panel in each figure represents the virological and sALT data as in Fig. 1. The fold induction of intrahepatic mRNA compared to two preinoculation time points was calculated and shown as a shaded gray area for CD8 (second panel), MIG (third panel), granzyme B (fourth panel), perforin (fifth panel), FAS (sixth panel), FAS-ligand (seventh panel), and PD-1 (eighth panel).
FIG. 3.
FIG. 3.
Intrahepatic mRNA induction profiles in infected animals. The first panel in each figure represents the virological and sALT data as in Fig. 1. The fold induction of intrahepatic mRNA compared to two preinoculation time points was calculated and shown as a shaded gray area for CD8 (second panel), MIG (third panel), granzyme B (fourth panel), perforin (fifth panel), FAS (sixth panel), FAS-ligand (seventh panel), and PD-1 (eighth panel).
FIG. 4.
FIG. 4.
Course of HBV infections, peripheral CD4+ T-cell responses against HBV core protein, and intrahepatic CD8+ T-cell responses in chimpanzees with or without CD4 immunodepletion. Serum HBV DNA level, serum HBe and HBs antigen levels, and the presence of anti-HBc, anti-HBe, and anti-HBs antibodies are shown as in Fig. 1 (top panel). The numbers of CD4+ T cells per μl of whole blood are indicated as closed squares (top panel, right axis). Arrows on the top panels represent injections of control antibody (a) or anti-CD4 antibody (b). Peripheral CD4+ T-cell IFN-γ ELISPOT assays against HBV core protein (second panel) and detection of intrahepatic HBV-specific CD8+ T cells (bottom panel, left axis) were performed as described in Fig. 2 except that freshly prepared cells were used instead of cryopreserved cells. The fold induction of intrahepatic CD8 mRNA compared to two preinoculation time points is shown as a shaded red area (bottom panel, right axis). *, Tested and negative.

References

    1. Boettler, T., E. Panther, B. Bengsch, N. Nazarova, H. C. Spangenberg, H. E. Blum, and R. Thimme. 2006. Expression of the interleukin-7 receptor alpha chain (CD127) on virus-specific CD8+ T cells identifies functionally and phenotypically defined memory T cells during acute resolving hepatitis B virus infection. J. Virol. 80:3532-3540. - PMC - PubMed
    1. Boni, C., P. Fisicaro, C. Valdatta, B. Amadei, P. Di Vincenzo, T. Giuberti, D. Laccabue, A. Zerbini, A. Cavalli, G. Missale, A. Bertoletti, and C. Ferrari. 2007. Characterization of hepatitis B virus (HBV)-specific T-cell dysfunction in chronic HBV infection. J. Virol. 81:4215-4225. - PMC - PubMed
    1. Bowen, D. G., M. Zen, L. Holz, T. Davis, G. W. McCaughan, and P. Bertolino. 2004. The site of primary T-cell activation is a determinant of the balance between intrahepatic tolerance and immunity. J. Clin. Investig. 114:701-712. - PMC - PubMed
    1. Castellino, F., and R. N. Germain. 2006. Cooperation between CD4+ and CD8+ T cells: when, where, and how. Annu. Rev. Immunol. 24:519-540. - PubMed
    1. Chisari, F. V., and C. Ferrari. 1995. Hepatitis B virus immunopathogenesis. Annu. Rev. Immunol. 13:29-60. - PubMed

Publication types