. 2009 Oct;83(19):9694-708.
doi: 10.1128/JVI.00925-09. Epub 2009 Jul 22.

Human immunodeficiency virus type 1 V1-to-V5 envelope variants from the chronic phase of infection use CCR5 and fuse more efficiently than those from early after infection

Affiliations

Human immunodeficiency virus type 1 V1-to-V5 envelope variants from the chronic phase of infection use CCR5 and fuse more efficiently than those from early after infection

Behzad Etemad et al. J Virol. 2009 Oct.

Abstract

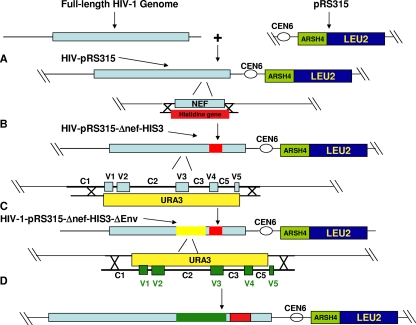
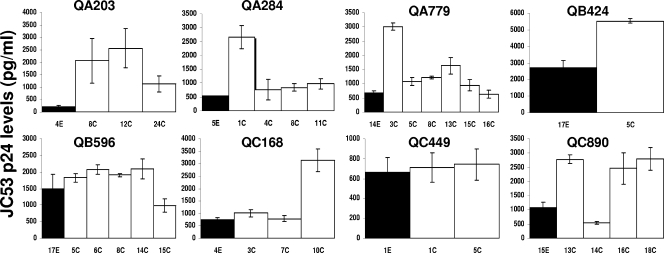
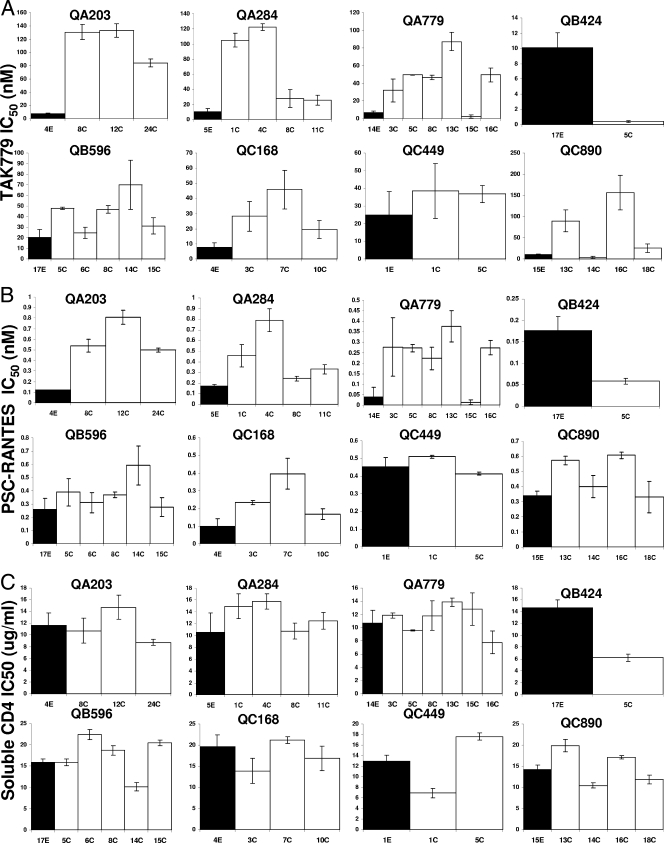
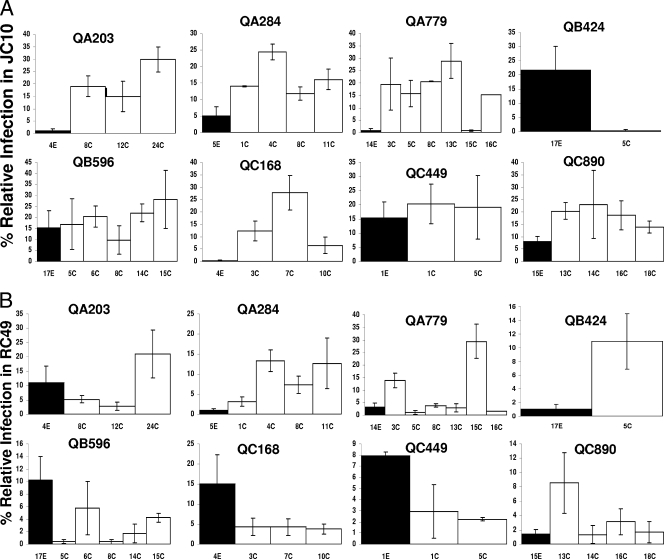
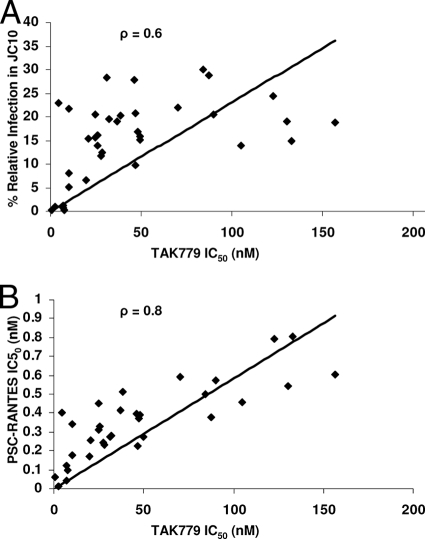
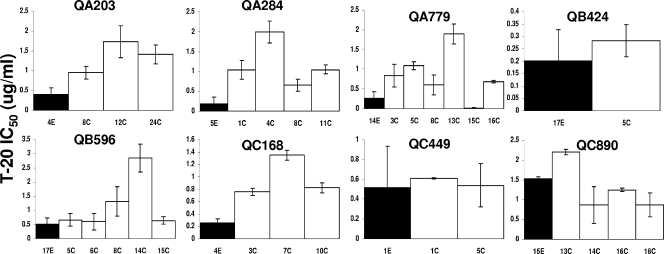
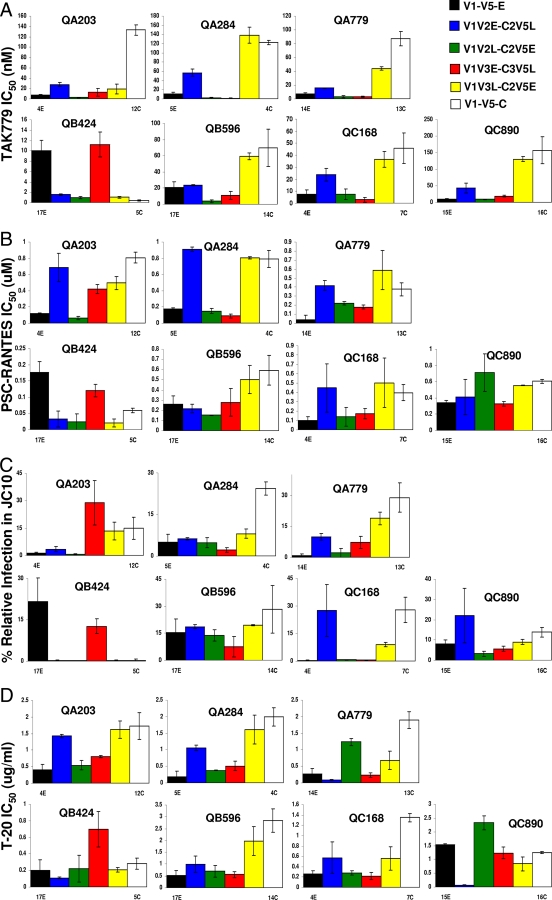
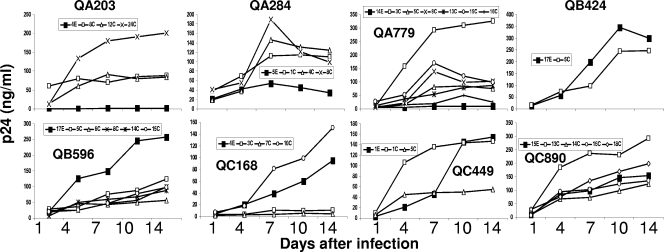
Human immunodeficiency virus type 1 (HIV-1) envelope glycoprotein modifications over the course of infection have been associated with coreceptor switching and antibody neutralization resistance, but the effect of the changes on replication and host cell receptor usage remains unclear. To examine this question, unique early- and chronic-stage infection envelope V1-to V5 (V1-V5) segments from eight HIV-1 subtype A-infected subjects were incorporated into an isogenic background to construct replication-competent recombinant viruses. In all subjects, viruses with chronic-infection V1-V5 segments showed greater replication capacity than those with early-infection V1-V5 domains in cell lines with high levels of both the CD4 and the CCR5 receptors. Viruses with chronic-infection V1-V5s demonstrated a significantly increased ability to replicate in cells with low CCR5 receptor levels and greater resistance to CCR5 receptor and fusion inhibitors compared to those with early-infection V1-V5 segments. These properties were associated with sequence changes in the envelope V1-V3 segments. Viruses with the envelope segments from the two infection time points showed no significant difference in their ability to infect cells with low CD4 receptor densities, in their sensitivity to soluble CD4, or in their replication capacity in monocyte-derived macrophages. Our results suggest that envelope changes, primarily in the V1-V3 domains, increase both the ability to use the CCR5 receptor and fusion kinetics. Thus, envelope modifications over time within a host potentially enhance replication capacity.


Figures

FIG. 1.
FIG. 1.
Construction of viruses using yeast gap repair homologous recombination. (A) A full-length HIV-1 clone was isolated and ligated into the multiple-cloning site of pRS315 (New England Biolabs). pRS315 sequences permit plasmid replication in both bacteria and yeast, and pRS315 also contains the beta-isopropylmalate dehydrogenase gene for the leucine synthetic pathway (LEU2). Thus, yeast with the recombined plasmid can be selected in leucine dropout media. (B) The yeast selection gene, for histidine (HIS3), was amplified with primers that contained the HIS3 gene sequences at the 3′ end flanked by nef homologous sequences at the 5′ end. This PCR product and the HIV-pRS315 plasmid linearized by endonuclease digestion within the nef gene were used to transform yeast and recover the HIV-pRS315-Δnef-HIS3 plasmid. (C) The URA3 gene was amplified from pRS316 (New England Biolabs) using primers that contained the URA3 gene sequences at the 3′ end flanked by sequences homologous to the HIV-1 envelope. URA3 encodes the orotidine-5′-phosphatase decarboxylase protein involved in the biosynthesis of uracil. Yeast was transformed with HIV-pRS315-Δnef-HIS3 plasmid linearized by endonuclease digestion within the env gene and the URA3 PCR product. Yeast with the recombined plasmid (HIV-pRS315-Δnef-HIS3-ΔEnv) was selected in leucine, histidine, and uracil dropout media. (D) Yeast was transformed with the HIV-pRS315-Δnef-HIS3-ΔEnv plasmid linearized with endonuclease digestion within URA and an envelope PCR product of interest. Recombined plasmid was isolated from yeast selected in leucine and histidine dropout media enriched with FOA. URA3 converts FOA to a toxic product which inhibits yeast with URA3 expression.
FIG. 2.
FIG. 2.
Replication in cells with high levels of CD4 and CCR5 receptors (JC53). Each graph shows the p24 production 7 days after infection for virus with early-infection V1-V5 segments (black bars) and viruses with chronic-infection V1-V5 sequences (white bars). Note that the y axis scale, which depicts p24 levels, is different in each graph. The subject identification is denoted above each graph, and the V1-V5 segment identification is below each column. All infection levels represent mean values from two or more independent experiments. The error bars show the standard deviations.
FIG. 3.
FIG. 3.
Sensitivity to TAK779 (A), PSC-RANTES (B), and soluble CD4 (C) of viruses with early-infection V1-V5 portions (black bars) or chronic-infection V1-V5 segments (white bars). The y axis shows the IC50s for each inhibitor. Note that the y axis scale is different in each graph. The subject identification is denoted above each graph, and the V1-V5 segment identification is below each column. All IC50s represent mean values from two or more independent experiments. The error bars show the standard deviations.
FIG. 4.
FIG. 4.
Relative replication in cells with high CD4 and low CCR5 levels (JC10) (A) and in cells with low CD4 and medium CCR5 levels (RC49) (B) among viruses with early-infection V1-V5 portions (black bars) or chronic-infection V1-V5 segments (white bars). In each graph, the y axis shows the infection levels in the respective cell lines. Note that the y axis scale is different in each graph. These values are normalized relative to the infection levels in the high-CD4, high-CCR5 (JC-53) cell line. The subject identification is denoted above each graph, and the V1-V5 segment identification is below each column. All infection levels represent mean values from two or more independent experiments. The error bars show the standard deviations.
FIG. 5.
FIG. 5.
Association between sensitivity to TAK779 and both relative replication in cells with high CD4 and low CCR5 levels (JC10) (A) and sensitivity to PSC-RANTES (B). The y axis shows the relative infection in JC10 cells (A) and sensitivity to PSC-RANTES (B). The x axis shows the TAK779 sensitivity for each chimeric envelope, represented by individual dots. The line shows the best-fit linear regression curve, with the correlation coefficient listed on the top of the graph.
FIG. 6.
FIG. 6.
Sensitivity to fusion inhibitor T-20 among viruses with chronic-infection V1-V5 segments (white bars) versus those with early-infection V1-V5 portions (black bars). The y axis shows the IC50s against the fusion inhibitor. Note that the y axis scale is different in each graph. The subject identification is denoted above each graph, and the V1-V5 segment identification is below each column. All IC50s represent mean values from two or more independent experiments. The error bars show the standard deviations.
FIG. 7.
FIG. 7.
Early and chronic chimeric envelope TAK779 IC50s (A), PSC-RANTES IC50s (B), relative replication in high-CD4, low-CCR5 cells (JC10) (C), and T-20 IC50s (D). V1V2E-C2V5L (blue), V1V2L-C2V5E (green), V1V3E-C3V5L (red), and V1V3L-C3V5E (yellow) chimeras are shown. For reference, viruses with early-infection V1-V5 (black bars) and chronic-infection V1-V5 (white bars) segments from which the envelope portions for the chimeras were derived are also shown. The y axis shows the IC50s for each inhibitor (A and C) and relative replication levels (B). The y axis scale is different among the graphs. Subject identifications are denoted above each graph. All values represent mean values from two or more independent experiments with viral stocks from two separate preparations. The error bars show the standard deviations.
FIG. 8.
FIG. 8.
Replication in MDMs. Each graph shows the p24 production of virus with early-infection V1-V5 segment (filled symbols) and viruses with chronic-infection V1-V5 sequences (open symbols) over time in MDMs. Note that the y axis scale, which depicts p24 levels, is different in each graph. The subject identification is denoted above each graph, and the V1-V5 segment identification is documented in the insets.

Similar articles

Cited by

References

    1. Alkhatib, G., M. Locati, P. E. Kennedy, P. M. Murphy, and E. A. Berger. 1997. HIV-1 coreceptor activity of CCR5 and its inhibition by chemokines: independence from G protein signaling and importance of coreceptor downmodulation. Virology 234:340-348. - PubMed
    1. Baba, M., O. Nishimura, N. Kanzaki, M. Okamoto, H. Sawada, Y. Iizawa, M. Shiraishi, Y. Aramaki, K. Okonogi, Y. Ogawa, K. Meguro, and M. Fujino. 1999. A small-molecule, nonpeptide CCR5 antagonist with highly potent and selective anti-HIV-1 activity. Proc. Natl. Acad. Sci. USA 96:5698-5703. - PMC - PubMed
    1. Ball, S. C., A. Abraha, K. R. Collins, A. J. Marozsan, H. Baird, M. E. Quinones-Mateu, A. Penn-Nicholson, M. Murray, N. Richard, M. Lobritz, P. A. Zimmerman, T. Kawamura, A. Blauvelt, and E. J. Arts. 2003. Comparing the ex vivo fitness of CCR5-tropic human immunodeficiency virus type 1 isolates of subtypes B and C. J. Virol. 77:1021-1038. - PMC - PubMed
    1. Blaak, H., M. Brouwer, L. J. Ran, F. de Wolf, and H. Schuitemaker. 1998. In vitro replication kinetics of human immunodeficiency virus type 1 (HIV-1) variants in relation to virus load in long-term survivors of HIV-1 infection. J. Infect. Dis. 177:600-610. - PubMed
    1. Brenchley, J. M., T. W. Schacker, L. E. Ruff, D. A. Price, J. H. Taylor, G. J. Beilman, P. L. Nguyen, A. Khoruts, M. Larson, A. T. Haase, and D. C. Douek. 2004. CD4+ T cell depletion during all stages of HIV disease occurs predominantly in the gastrointestinal tract. J. Exp. Med. 200:749-759. - PMC - PubMed

Publication types