. 2009 Sep;20(18):4070-82.
doi: 10.1091/mbc.e09-01-0041. Epub 2009 Jul 22.

Guanine nucleotide exchange factor-H1 regulates cell migration via localized activation of RhoA at the leading edge

Affiliations

Guanine nucleotide exchange factor-H1 regulates cell migration via localized activation of RhoA at the leading edge

Perihan Nalbant et al. Mol Biol Cell. 2009 Sep.

Abstract

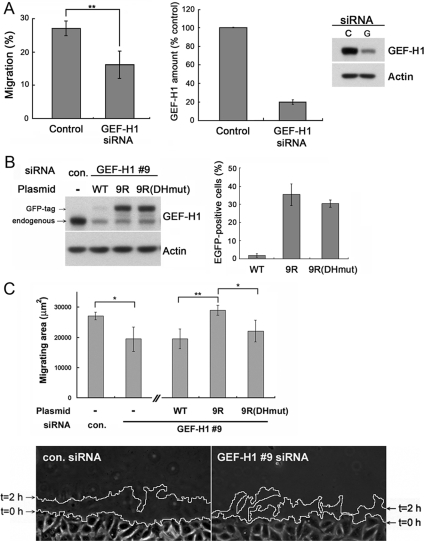
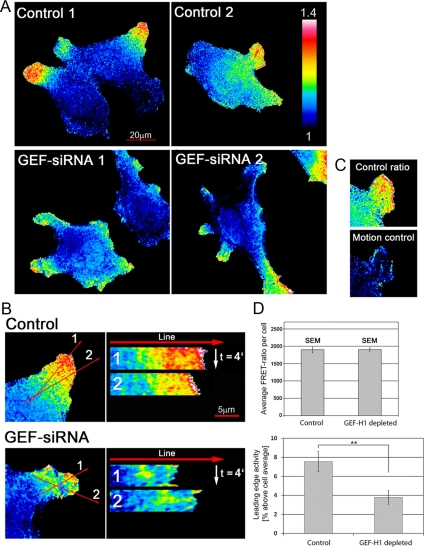
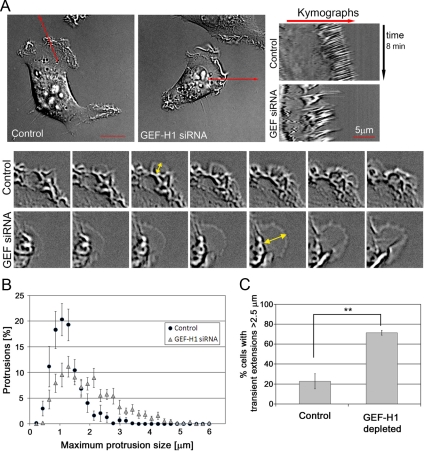
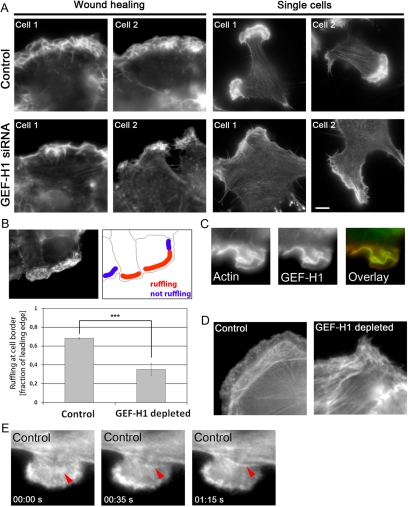
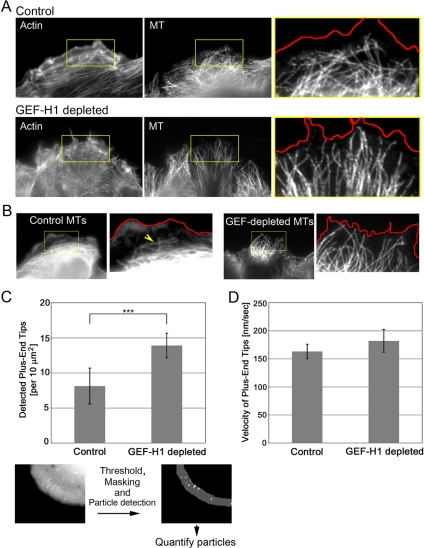
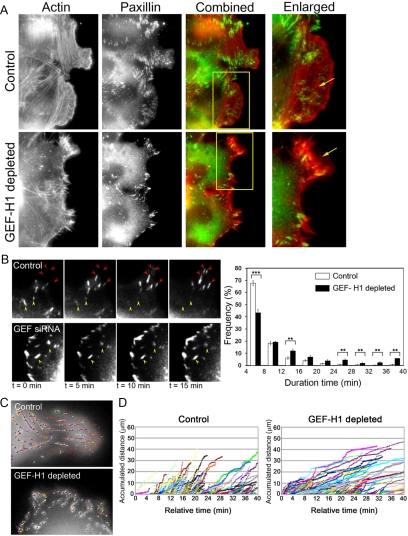
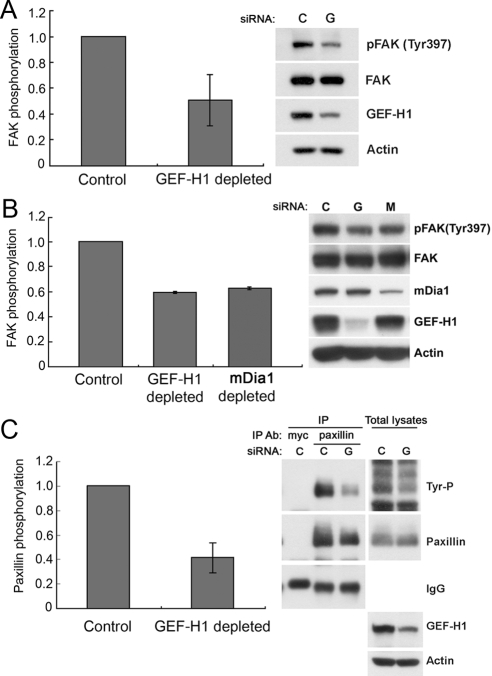
Cell migration involves the cooperative reorganization of the actin and microtubule cytoskeletons, as well as the turnover of cell-substrate adhesions, under the control of Rho family GTPases. RhoA is activated at the leading edge of motile cells by unknown mechanisms to control actin stress fiber assembly, contractility, and focal adhesion dynamics. The microtubule-associated guanine nucleotide exchange factor (GEF)-H1 activates RhoA when released from microtubules to initiate a RhoA/Rho kinase/myosin light chain signaling pathway that regulates cellular contractility. However, the contributions of activated GEF-H1 to coordination of cytoskeletal dynamics during cell migration are unknown. We show that small interfering RNA-induced GEF-H1 depletion leads to decreased HeLa cell directional migration due to the loss of the Rho exchange activity of GEF-H1. Analysis of RhoA activity by using a live cell biosensor revealed that GEF-H1 controls localized activation of RhoA at the leading edge. The loss of GEF-H1 is associated with altered leading edge actin dynamics, as well as increased focal adhesion lifetimes. Tyrosine phosphorylation of focal adhesion kinase and paxillin at residues critical for the regulation of focal adhesion dynamics was diminished in the absence of GEF-H1/RhoA signaling. This study establishes GEF-H1 as a critical organizer of key structural and signaling components of cell migration through the localized regulation of RhoA activity at the cell leading edge.


Figures

Figure 1.
Figure 1.
GEF-H1–depleted cells migrate slower. (A) Three-dimensional migration of HeLa cells is inhibited upon GEF-H1 depletion. At 72 h post-siRNA transfection, cells were either harvested for Western blotting or seeded on a 3D migration filter coated with fibronectin matrix to allow migration through the filter for 6 h. Left, percentage of migrated cells. Results are means ± SD from three independent transfection experiments. Middle, GEF-H1 protein level in control and GEF-H1 siRNA treated cells. GEF-H1 amount was quantified by Western blot using anti-GEF-H1 antibody at 72 h post-siRNA transfection. Results are means ± SD from n = 8 independent transfection experiments. Right, representative blot. See also Supplemental Figure 1 for single cell quantification. (B) Transfection of siRNA-resistant EGFP-GEF-H1 plasmids in HeLa cells. Cells were treated with control or GEF-H1-specific #9 siRNA and transfected with the indicated EGFP-GEF-H1 plasmids 48 h post-siRNA treatment. 9R and 9RDHmut represent EGFP-GEF-H1 constructs resistant to GEF-H1-specific siRNA oligo #9. At 72 h post-siRNA transfection, cells were lysed to analyze GEF-H1 expression level by Western blot using anti-GEF-H1 antibody (left). In parallel, transfected cells were fixed to visualize EGFP fluorescence together with nuclear 4,6-diamidino-2-phenylindole staining to quantify the percentage of EGFP positive cells (right). Results are ±SD from three independent experiments. (C) In vitro wound healing of HeLa cells in 2D. At 72 h post-siRNA transfection, a scratch was generated into the confluent monolayer and cells were allowed to migrate for 2 h. Cell outlines were drawn along the wound edge at time = 0 h (imaging start) and 2 h, as indicated in the bottom panel. Migration was quantified by calculating the area between the two outlines by using MetaMorph software. Results are the means ± SD of four independent experiments. Bottom, representative migration area after 2 h of wound closure of control and GEF-H1–specific #9 siRNA-treated cells. *p < 0.05 and **p < 0.01.
Figure 2.
Figure 2.
Depletion of GEF-H1 perturbs localized activation of RhoA at the edge of migrating HeLa cells. HeLa cells stably expressing a FRET biosensor for RhoA activity were transfected with control- and GEF-H1-siRNA, respectively, with >95% efficiency, and then cells selected at random for imaging. FRET ratio images denote activity patterns of RhoA under the conditions depicted. (A) Two representative pseudocolor images for localization of RhoA activity are shown for each condition. Bar, 20 μm. n = 18 control and 14 GEF-H1–depleted cells, respectively, from three independent experiments. (B) Localized RhoA activation in cell protrusions over time was assessed using time-lapse movies and kymographs. The first frame of representative movies is shown for cells with control and GEF-H1 siRNA. Kymographs were generated using ImageJ software with a bin-width of 1 and subjected afterward to an in-built Gaussian Blur Filter (σ radius = 1). Two typical kymographs per cell are shown (bar, 5 μm). The time-frame was 10 s for the duration of 4 min. (C) Motion control. False positive signals due to cell movement between the sequential CFP and FRET image acquisition. Three images were acquired: CFP-1, FRET, and CFP-2. Left, the actual ratio image was derived by dividing FRET by CFP-1. Right, the control image was obtained by dividing CFP-2 by CFP-1 to reveal maximum possible motion-related error. (D) Leading edge activity is decreased in cells depleted of GEF-H1. Top, average RhoA activation levels per cell were determined by measuring the average signal intensity of each ratio image with the built-in ImageJ “measure” tool. Results are means ± SEM from 34 (control) and 49 (GEF-H1–depleted) cells (n = 3 experiments). Bottom, RhoA activity in the leading edge relative to the cell average. A 1-μm-wide line was drawn along the border of each protrusion and average activity was measured within this region. Relative RhoA activity in the leading edge was calculated by division with overall average activity of the same cell. Only cells from time-lapse experiments were analyzed to focus on dynamic cell protrusions. Results are means ± SEM from 32 (control) and 33 (GEF-H1–depleted) cell protrusions with p value = 0.0047 (11 control and 10 GEF-H1 siRNA–treated cells).
Figure 3.
Figure 3.
Dynamics of the leading edge is altered in GEF-H1 depleted cells. Cells were replated on glass coverslips 24 h post-siRNA transfection and subjected to time-lapse DIC microscopy at 72 h after transfection. Ruffling cells were chosen randomly for imaging purposes. Ruffling was defined by three-dimensional movement of the cell membrane inward from the leading edge. (A) Kymograph analysis of control- and GEF-H1–depleted cells. Left, representative images (first frame) of control- and GEF-H1–depleted cell movies. Bar, 10 μm. Right, representative kymographs. Kymographs of 73 control and 95 GEF-H1–depleted cells were generated using a built-in macro in MetaMorph software (n = 3 independent experiments). Frame rate, 5 s. The bottom two panels show a representative region of a control and GEF-H1–depleted cell, respectively. The maximum size of individual protrusions is indicated by yellow arrows. (B) Kymographs were used to measure maximum protrusion size during time-lapse recordings. n = 11 control and 10 GEF-H1–depleted cells from two independent experiments were analyzed. In total, 695 (control) and 602 (GEF-H1 siRNA) protrusions were measured. (C) Percentage of cells forming extensions >2.5 μm. Extensions were measured using the line tool. Each cell observed by time-lapse imaging was analyzed to avoid bias. Cells which formed neither ruffles, nor protrusions were neglected. Results are means ± SD of 76 control and 87 GEF-H1–depleted cells from three independent DIC time-lapse experiments. Significance between the two conditions was tested using t test analysis (**p < 0.01).
Figure 4.
Figure 4.
The actin cytoskeleton is altered in cells lacking GEF-H1. (A) Actin cytoskeleton of control and GEF-H1–depleted cells. Cells were stained using rhodamine-conjugated phalloidin. Left, two cells during wound healing. Right, single migrating cells (see also Supplemental Figure S5 for quantification of actin staining in the leading edge). Bar, 5 μm. (B) Leading edge integrity is compromised in cells depleted of GEF-H1. Imaging was performed along the wound at randomly chosen regions, and every cell in each image was analyzed. For each individual cell, the length of the entire leading edge region was measured using the line tool (ImageJ). In a second step, length of ruffling regions within the leading edge was measured (depicted in red in the schematic). Ruffling was defined as actin accumulation in a typically curled shape similar to three-dimensional membrane folds observed in DIC movies. “Ruffling at cell border” was calculated as fraction of the leading edge. Results are means ± SD of n = 2 independent experiments with 179 control and 232 GEF-H1–depleted cells. Statistical significance of the difference between the two conditions was assessed using t test analysis of all control versus GEF-H1–depleted cells (p = 7.17 e−11). (C) Colocalization of endogenous GEF-H1 and actin in membrane ruffles of migrating cells at the wound edge. (D) Stress fiber organization in the leading edge during wound healing. At low focus, actin fibers perpendicular to the cell edge were visible. (E) Example frames derived from the EGFP-actin movie of a control cell showing the formation of an actin bundle (red arrow) from an inward ruffling region (see also Supplemental Movie S4 and text). Frame rate, 5 s.
Figure 5.
Figure 5.
Microtubule organization is perturbed upon GEF-H1 depletion. (A) Costaining of the actin and the MT cytoskeleton. The figure shows cells migrating into the wound. Cells were fixed at 2 h after wound and stained with rhodamine-conjugated phalloidin and anti-α-tubulin antibody. To visualize the stress fibers, cells were imaged at low focus. A red line depicting the leading edge was generated based on the actin image and pasted onto the MT image to demonstrate the distance of MTs to the cell edge (enlarged box shown at right). (B) MT alignment with respect to the leading edge in migrating cells. Red line represents the actin boundary. (C) Quantification of MT tips approaching the leading edge. Cells were transfected with EGFP-EB-1 construct and subjected to fluorescence time-lapse imaging (frame rate, 5 s). The average number of EGFP-EB-1–decorated MT tips within a defined edge region was quantified as described in the bottom panels and in Supplemental Material. Results are means ± SD of four (control) and five (GEF-H1–depleted) cells, with each three analyzed regions. Statistical significance was assessed using Student's t test. p = 0.0048 (see also Supplemental Figure S9 for measurements with a significant number of fixed cells). (D) The velocity of EGFP-EB-1–decorated tips was measured using the Particle Tracker tool (ImageJ). Results are means ± SD of 196 (control) and 137 (GEF-H1–depleted) particles tracked in each five cells.
Figure 6.
Figure 6.
Turnover of focal adhesions is perturbed in GEF-H1-depleted cells. (A) Control or GEF-H1–depleted cells were fixed 2 h after wound and immunostained using antibody for paxillin together with rhodamine-labeled phalloidin. Arrow in enlarged control image indicates small focal complexes in the leading edge, whereas the arrow in the GEF-H1 siRNA-treated cell points to an extension deficient in paxillin-containing foci. (B) Left, representative EGFP-paxillin time-lapse images showing generation (red arrows) and dissolution (yellow arrows) of focal adhesions (see also Supplemental Movie S7). Right, frequency (percentage) of detected focal adhesions with the indicated “live-time” (detection duration). Particles were detected with IMARIS 5.0 software (Bitplane) and analyzed using Excel software (Microsoft, Redmond, WA). Binning, 4 min. Results are means ± SE of 10 regions in five control cells and 12 regions in six GEF-H1–depleted cells. Significance between the two conditions was tested for each time range. p < 0.05, **p < 0.01, and ***p < 0.001. (C) Focal adhesion sliding in GEF-H1–depleted cells is slower than in control cells. Time-lapse videos of EGFP-paxillin–expressing cells were recorded for 40 min and analyzed to track EGFP-paxillin containing focal adhesions by IMARIS 5.0. Representative snapshots: gray dots show detected EGFP-paxillin foci. Colored lines display the tracked path of each dot during the time-lapse experiment. (D) Accumulated distance of tracked focal adhesion dots as measured using Image-Pro Plus software. Figures show representative analyses in which the slope is indicative of the speed of the detected adhesion point. Each colored line represents a detected and traced focal adhesion.
Figure 7.
Figure 7.
Tyrosine phosphorylation of focal adhesion components is altered in cells lacking GEF-H1. (A) Tyrosine phosphorylation of focal adhesion kinase is decreased in cells lacking GEF-H1. Cell lysates of control and GEF-H1–depleted cells were collected and examined by immunoblot for pFAK(Y397) and total FAK. For quantification, phosphorylated FAK was normalized to the amount of total FAK from whole cell lysates. Results are from n = 3 independent experiments, means ± SD. (B) Depletion of mDia1 leads to decreased FAK tyrosine phosphorylation during in vitro wound healing. Cells were transfected with control, GEF-H1 or mDia1 siRNA. At 72 h post-siRNA transfection, multiple scratch wounds were generated (18/3.5-cm dish), and cells were allowed to migrate for 6 h. Protein samples were collected and subjected to immunoblotting for pFAK(Y397) and total FAK. Left, quantification of pFAK(Y397) normalized to total FAK protein. Results are from n = 2 independent experiments, means ± SD (C) Tyrosine phosphorylation of paxillin is decreased in GEF-H1–depleted cells. Cell lysates of control and GEF-H1–depleted cells were IPed by using anti-paxillin antibody. Immunoprecipitates and total cell lysates were separated by SDS-PAGE and subjected to immunoblotting with the anti-phospho-tyrosine antibody 4G10 (Tyr-P). The membrane was stripped and reprobed with anti-paxillin antibody. Left, relative quantification of phospho-tyrosine paxillin to total paxillin from two independent IP experiments (means ± SD).

Similar articles

Cited by

References

    1. Baudoin J. P., Alvarez C., Gaspar P., Métin C. Nocodazole-induced changes in microtubule dynamics impair the morphology and directionality of migrating medial ganglionic eminence cells. Dev. Neurosci. 2008;30:132–143. - PubMed
    1. Benais-Pont G., Punn A., Flores-Maldonado C., Eckert J., Raposo G., Fleming T. P., Cereijido M., Balda M. S., Matter K. Identification of a tight junction-associated guanine nucleotide exchange factor that activates Rho and regulates paracellular permeability. J. Cell Biol. 2003;160:729–740. - PMC - PubMed
    1. Bershadsky A. D., Balaban N. Q., Geiger B. Adhesion-dependent cell mechanosensitivity. Annu. Rev. Cell Dev. Biol. 2003;19:677–695. - PubMed
    1. Birkenfeld J., Nalbant P., Bohl B. P., Pertz O., Hahn K. M., Bokoch G. M. GEF-H1 modulates localized RhoA activation during cytokinesis under the control of mitotic kinases. Dev. Cell. 2007;12:699–712. - PMC - PubMed
    1. Brown M. C., Turner C. E. Paxillin: adapting to change. Physiol. Rev. 2004;84:1315–1339. - PubMed

Publication types

MeSH terms

LinkOut - more resources