

Evaluation of the Abbott investigational use only RealTime hepatitis C virus (HCV) assay and comparison to the Roche TaqMan HCV analyte-specific reagent assay
- PMID: 19625475
- PMCID: PMC2738061
- DOI: 10.1128/JCM.02329-08
Evaluation of the Abbott investigational use only RealTime hepatitis C virus (HCV) assay and comparison to the Roche TaqMan HCV analyte-specific reagent assay
Abstract
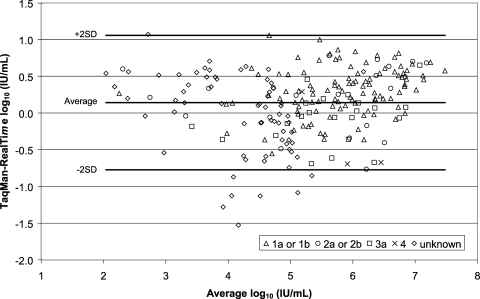
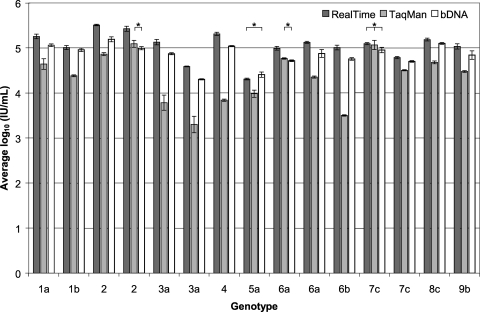
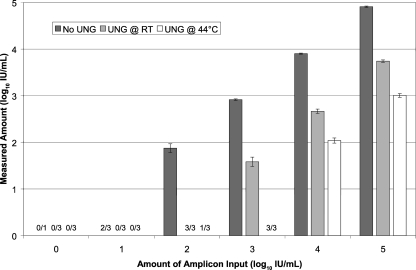
The accurate and sensitive measurement of hepatitis C virus (HCV) RNA is essential for the clinical management and treatment of infected patients and as a research tool for studying the biology of HCV infection. We evaluated the linearity, reproducibility, precision, limit of detection, and concordance of viral genotype quantitation of the Abbott investigational use only RealTime HCV (RealTime) assay using the Abbott m2000 platform and compared the results to those of the Roche TaqMan Analyte-Specific Reagent (TaqMan) and Bayer Versant HCV bDNA 3.0 assay. Comparison of 216 samples analyzed by RealTime and TaqMan assays produced the following Deming regression equation: RealTime = 0.940 (TaqMan) + 0.175 log(10) HCV RNA IU/ml. The average difference between the assays was 0.143 log(10) RNA IU/ml and was consistent across RealTime's dynamic range of nearly 7 log(10) HCV RNA IU/ml. There was no significant difference between genotypes among these samples. The limit of detection using eight replicates of the World Health Organization HCV standard was determined to be 7.74 HCV RNA IU/ml by probit analysis. Replicate measurements of commercial genotype panels were significantly higher than TaqMan measurements for most samples and showed that the RealTime assay is able to detect all genotypes with no bias. Additionally, we showed that the amplicon generated by the widely used Roche COBAS Amplicor Hepatitis C Virus Test, version 2.0, can act as a template in the RealTime assay, but potential cross-contamination could be mitigated by treatment with uracil-N-glycosylase. In conclusion, the RealTime assay accurately measured HCV viral loads over a broad dynamic range, with no significant genotype bias.
Figures
Similar articles
-
Analytical characteristics and comparative evaluation of Aptima HCV quant Dx assay with the Abbott RealTime HCV assay and Roche COBAS AmpliPrep/COBAS TaqMan HCV quantitative test v2.0.Virol J. 2017 Apr 4;14(1):66. doi: 10.1186/s12985-017-0727-3. Virol J. 2017. PMID: 28372576 Free PMC article.
-
Performance of the Abbott RealTime and Roche Cobas TaqMan hepatitis C virus (HCV) assays for quantification of HCV genotypes.J Clin Microbiol. 2012 May;50(5):1769-72. doi: 10.1128/JCM.06723-11. Epub 2012 Feb 29. J Clin Microbiol. 2012. PMID: 22378914 Free PMC article.
-
Multilaboratory comparison of hepatitis C virus viral load assays.J Clin Microbiol. 2006 May;44(5):1726-32. doi: 10.1128/JCM.44.5.1726-1732.2006. J Clin Microbiol. 2006. PMID: 16672399 Free PMC article.
-
Impact of hepatitis C virus (HCV) genotypes on quantification of HCV RNA in serum by COBAS AmpliPrep/COBAS TaqMan HCV test, Abbott HCV realtime assay [corrected] and VERSANT HCV RNA assay.J Clin Microbiol. 2007 Sep;45(9):3077-81. doi: 10.1128/JCM.00111-07. Epub 2007 Jun 20. J Clin Microbiol. 2007. PMID: 17581929 Free PMC article.
-
Differences between two real-time PCR-based hepatitis C virus (HCV) assays (RealTime HCV and Cobas AmpliPrep/Cobas TaqMan) and one signal amplification assay (Versant HCV RNA 3.0) for RNA detection and quantification.J Clin Microbiol. 2008 Dec;46(12):3880-91. doi: 10.1128/JCM.00755-08. Epub 2008 Sep 17. J Clin Microbiol. 2008. PMID: 18799708 Free PMC article.
Cited by
-
Clinical Laboratory Testing in the Era of Directly Acting Antiviral Therapies for Hepatitis C.Clin Microbiol Rev. 2017 Jan;30(1):23-42. doi: 10.1128/CMR.00037-16. Epub 2016 Oct 19. Clin Microbiol Rev. 2017. PMID: 27795306 Free PMC article. Review.
-
Real-Time PCR Assays for the Quantification of HCV RNA: Concordance, Discrepancies and Implications for Response Guided Therapy.PLoS One. 2015 Aug 14;10(8):e0135963. doi: 10.1371/journal.pone.0135963. eCollection 2015. PLoS One. 2015. PMID: 26274922 Free PMC article.
-
Strong correlation between liver and serum levels of hepatitis C virus core antigen and RNA in chronically infected patients.J Clin Microbiol. 2012 Feb;50(2):465-8. doi: 10.1128/JCM.06503-11. Epub 2011 Dec 7. J Clin Microbiol. 2012. PMID: 22162563 Free PMC article.
-
Sequence conservation of the region targeted by the Abbott RealTime HCV viral load assay.J Clin Microbiol. 2014 Apr;52(4):1220-1. doi: 10.1128/JCM.02661-13. Epub 2014 Jan 15. J Clin Microbiol. 2014. PMID: 24430453 Free PMC article.
-
HCV core antigen and HCV-RNA in HIV/HCV co-infected patients with different HCV genotypes.BMC Infect Dis. 2014 Apr 23;14:222. doi: 10.1186/1471-2334-14-222. BMC Infect Dis. 2014. PMID: 24758157 Free PMC article.
References
-
- Bland, J. M., and D. G. Altman. 1986. Statistical methods for assessing agreement between two methods of clinical measurement. Lancet 1307-310. - PubMed
-
- Braun, P., R. Ehret, F. Wiesmann, F. Zabbai, M. Knickmann, R Kühn, S. Thamm, G. Warnat, and H. Knechten. 2007. Comparison of four commercial quantitative HIV-1 assays for viral load monitoring in clinical daily routine. Clin. Chem. Lab. Med. 4593-99. - PubMed
-
- Elbeik, T., R. Dalessandro, R. A. Loftus, and S. Beringer. 2007. HIV-1 and HCV viral load cost models for bDNA: 440 Molecular System versus real-time PCR AmpliPrep/TaqMan test. Expert Rev. Mol. Diagn. 7723-753. - PubMed
-
- Halfon, P., G. Pénaranda, M. Bourlière, H. Khiri, M.-F. Masseyeff, and D. Ouzan. 2006. Assessment of early virological response to antiviral therapy by comparing four assays for HCV RNA quantitation using the international unit standard: implications for clinical management of patients with chronic hepatitis C virus infection. J. Med. Virol. 78208-215. - PubMed
Publication types
MeSH terms
Substances
LinkOut - more resources
Full Text Sources
Medical
