. 2009 Jul 22;29(29):9163-73.
doi: 10.1523/JNEUROSCI.5741-08.2009.

Reduced amyloid deposition in mice overexpressing RTN3 is adversely affected by preformed dystrophic neurites

Affiliations

Reduced amyloid deposition in mice overexpressing RTN3 is adversely affected by preformed dystrophic neurites

Qi Shi et al. J Neurosci. .

Abstract

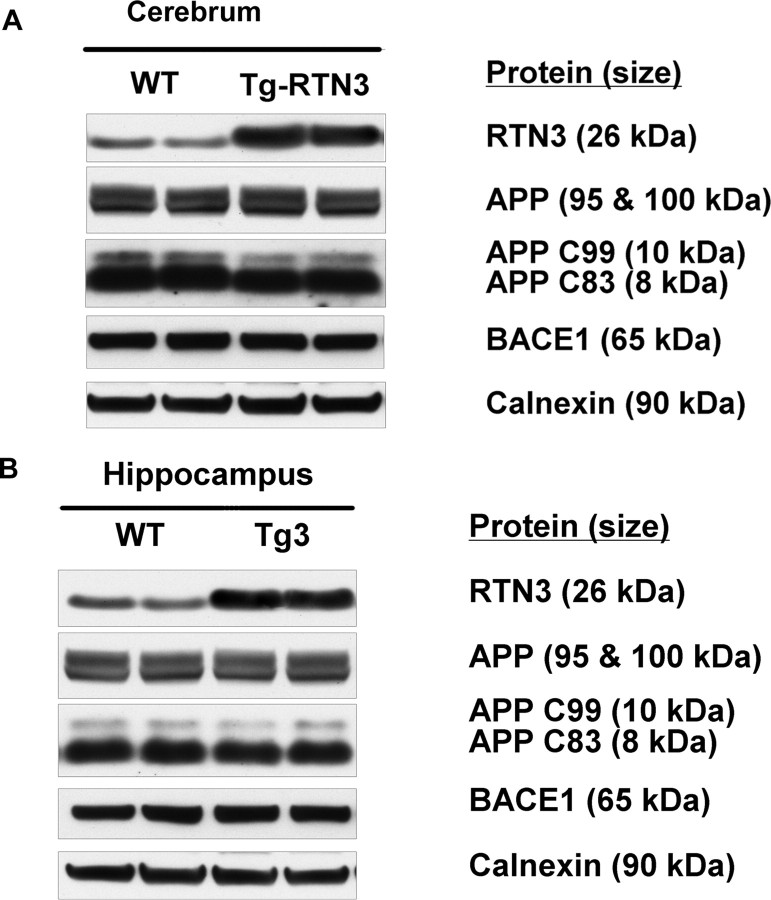
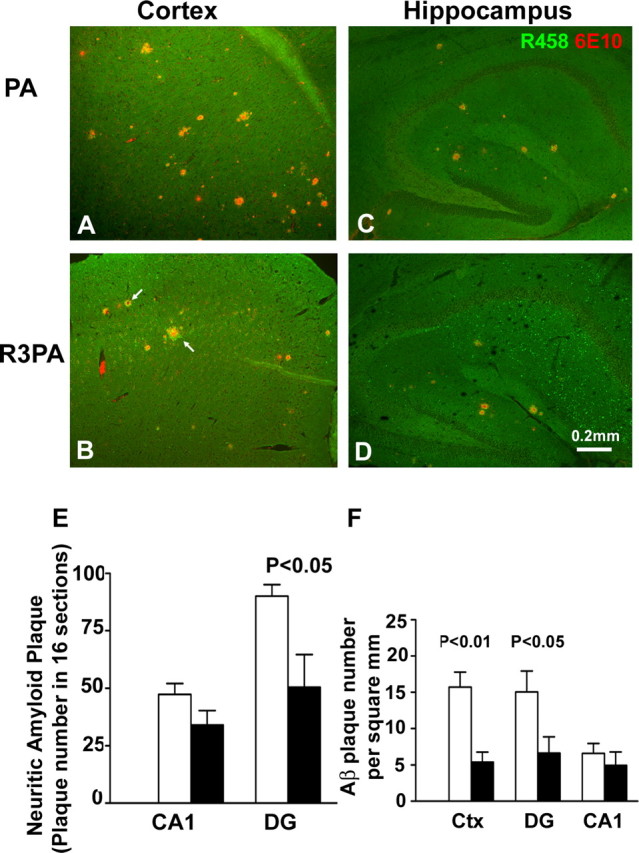
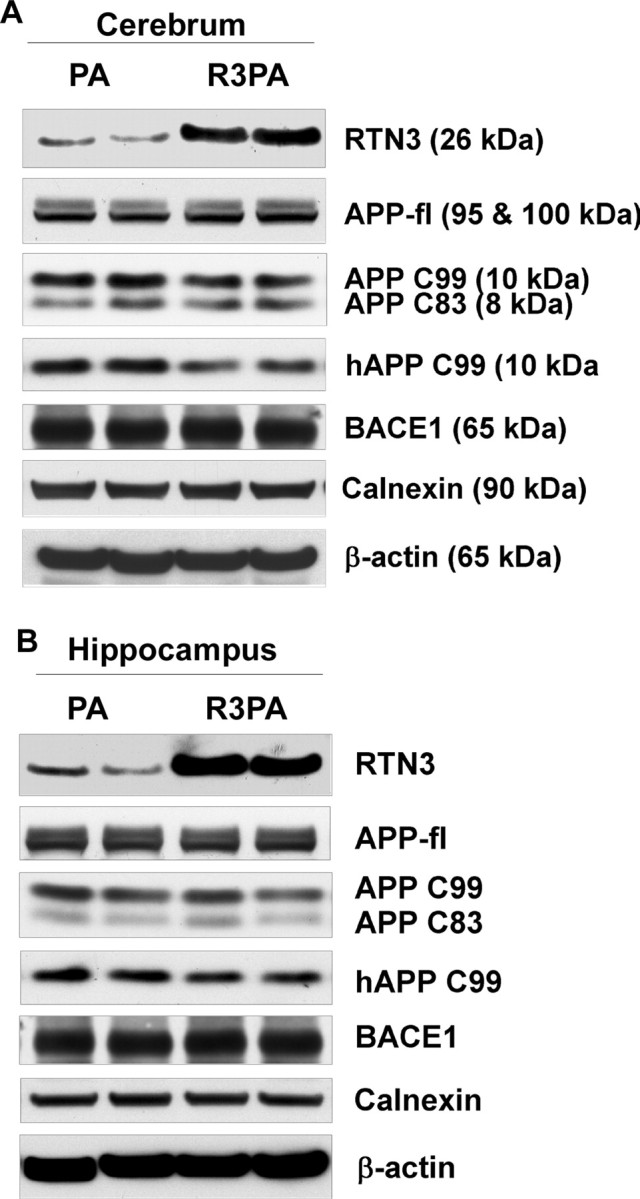
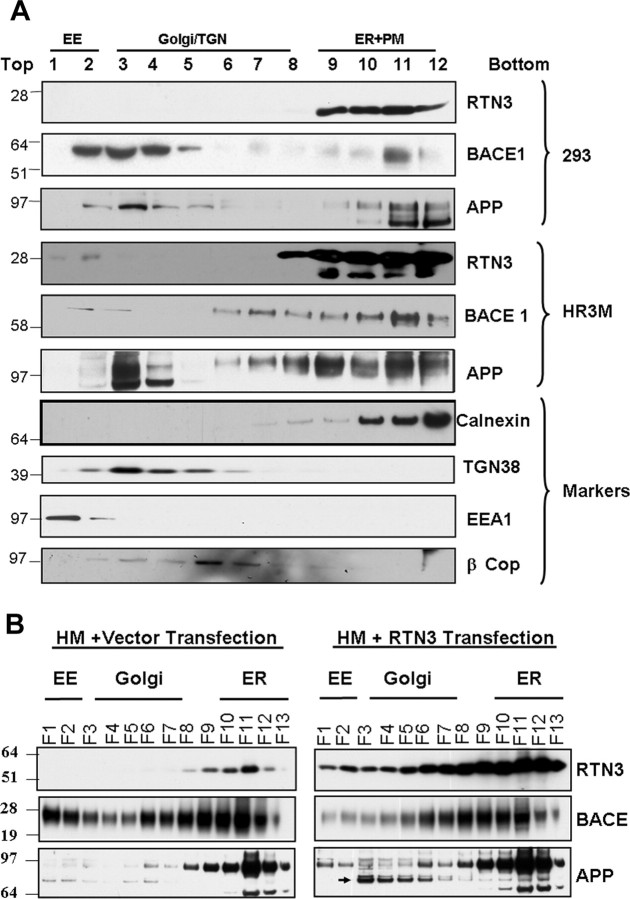
Reticulon 3 (RTN3) was initially identified as a negative modulator of BACE1, an enzyme that cleaves amyloid precursor protein (APP) to release beta-amyloid peptide. Interestingly, RTN3 can also form aggregates after accumulation, and increased RTN3 aggregation correlates with the formation of RTN3 immunoreactive dystrophic neurites (RIDNs) in brains of Alzheimer's cases. Transgenic mice expressing RTN3 alone develop RIDNs in their hippocampus but not in their cortex. To determine the in vivo effects of RTN3 and preformed RIDNs on amyloid deposition, we crossed bitransgenic mice expressing APP and presenilin 1 (PS1) mutations with mice overexpressing RTN3. We found that amyloid deposition in cortex, the hippocampal CA3 region, and dentate gyrus was significantly reduced in triple transgenic mice compared with bitransgenic controls. However, reduction of amyloid deposition in the hippocampal CA1 region, where RIDNs predominantly formed before amyloid deposition, was less significant. Hence, preformed RTN3 aggregates in RIDNs clearly offset the negative modulation of BACE1 activity by RTN3. Furthermore, our study indicates that the increased expression of RTN3 could result in an alteration of BACE1 intracellular trafficking by retaining more BACE1 in the endoplasmic reticulum compartment where cleavage of APP by BACE1 is less favored. Our results suggest that inhibition of RTN3 aggregation is likely to be beneficial by reducing both amyloid deposition and the formation RIDNs.


Figures

Figure 1.
Figure 1.
APP processing in RTN3 transgenic mice. A, Equal amounts of protein extracts from wild-type (WT) and transgenic mice expressing human RTN3 cDNA (Tg-RTN3) were analyzed by Western blotting. Antibody R458 recognizes the C terminus of RTN3, and higher levels of RTN3 were found in Tg-RTN3 samples. BACE1 is detected with antibody B279. Antibody A8717, specific to the APP C terminus, was used to detect full-length APP, its CTF99 and CTF83 fragments. Antibody recognizing calnexin was used to verify equal loading. The protein levels of full-length APP were normalized to calnexin level and the ratios of CTF99 to CTF83 or full-length APP were plotted to reflect the reduced levels of CTF99 in Tg-RTN3 cortex. These results were summarized from three independent experiments and demonstrated that in the Tg-RTN3 mice the ratio of CTF99 to CTF83 was reduced (p < 0.001), as was the ratio of CTF99 over APP (p < 0.001). However, there appeared to be very little difference in APP levels between WT and Tg-RTN3. B, The protein lysates from the hippocampus were analyzed in the same manner as in the cortex (A), but the reduction of CTF99 levels in the Tg-RTN3 hippocampal samples was less significant compared with the WT controls.
Figure 2.
Figure 2.
Reduced Aβ deposition in the brains of Tg-R3PA mice. A, B, Immunohistochemical analysis of condensed Aβ deposits in sagittal brain sections of 6-month-old Tg-PA (A) and Tg-R3PA mice (B) using antibody 6E10. Compared with Tg-PA mice, condensed Aβ deposits were significantly reduced in the cortex but the reduction was less obvious in the hippocampus of Tg-R3PA mice compared with Tg-PA mice. The foci of neuritic plaques were quantitatively analyzed based on manual counts of Aβ-immunoreactive deposits in sagittal sections of Tg-PA and Tg-R3PA brains under immunoconfocal microscopy. Sixteen sagittal sections (140 μm apart) from each Tg-PA mouse (n = 4) and Tg-R3PA mouse (n = 5) were examined. The average number of plaque counts for each mouse group is expressed as the number of neuritic plaques ± SEM (p < 0.01, unpaired t test). C, Reduced Aβ plaque load in Tg-R3PA mice. The Aβ plaque load was determined as a percentage of the area occupied by Aβ-immunoreactive condensed deposits in the total examined area. The imaging data for Aβ plaque load were collected form the same immunofluorescence-stained sections that were used for counting of plaque numbers (red channel), and analyzed with ImageJ software when only the red channel was turned on (p < 0.05, unpaired t test). D–G, Brain sagittal sections were also stained with the compound thioflavin S. Aggregated Aβ deposits in the cerebrum of the Tg-R3PA (E) were significantly reduced compared with the same area of Tg-PA mice (D). In contrast, the reduction was less significant in the hippocampal area of Tg-PA (F) and Tg-R3PA mice (G). ctx, Cerebral cortex; hipp, hippocampus. Scale bars: A, B, 0.5 mm; (in G) D-G, 0.2 mm.
Figure 3.
Figure 3.
Reduced neuritic plaques in the cerebral cortex of Tg-R3PA mice. A–D, Immunoconfocal analysis of condensed Aβ deposition in the hippocampus of Tg-PA and Tg-R3PA mice 6 months of age using antibody 6E10 against Aβ (red) and antibody R458 against RTN3 C terminus (green). Compared with Tg-PA mice, Tg-R3PA mice had a significantly lower amount of Aβ neuritic plaques in the cerebral cortex (A, B), but this reduction was less significant in their hippocampi (C, D). Noticeably, Tg-R3PA mice developed RIDNs largely in the CA1 region with a small spread to the CA3 and dentate gyrus regions, whereas Tg-PA mice did not produce a similar type of dispersed RIDNs. Although no dispersed RIDNs were found in the cortical region of either Tg-R3PA or Tg-PA mice, amyloid plaques in Tg-R3PA samples were visibly surrounded with more RIDNs as specified by arrows. E, The similarly labeled foci of neuritic plaques were quantitatively analyzed based on the indicated hippocampal subregions of Tg-PA and Tg-R3PA brains (p < 0.05, unpaired t test). F, The plaque numbers occupied per square mm of examined sections were also plotted to show the consistent reduction of amyloid plaques in the Tg-R3PA cortex but not in the CA1 region. Open bar represents PA mice and closed bar represents R3PA mice. Scale bar: (in D) A–D, 0.2 mm.
Figure 4.
Figure 4.
Production of Aβ was reduced in Tg-RTN3 mice. A, B, The levels of insoluble Aβ1–40 and Aβ1–42 extracted from cortical (A) and entire hippocampal (B) tissues were measured by sandwich ELISA. The Aβ values are expressed as the mean Aβ concentration ± SEM in pmol/g. Whereas there is a significant reduction of both insoluble Aβ1–40 and Aβ1–42 in Tg-R3PA cortex, the difference in the values of hippocampal insoluble Aβ between Tg-PA and Tg-R3PA mice was more moderate (*p < 0.05, **p < 0.01, n = 3; t test).
Figure 5.
Figure 5.
APP processing patterns in Tg-PA and Tg-R3PA mouse brains. A, B, Equal amounts of protein extracts from cerebral cortex (A) or hippocampus (B) of 180-d-old Tg-PA and Tg-R3PA mice were examined by Western blotting. Antibody 6E10 recognizes full-length APP and BACE1-cleaved human APP transgene product CTF99. BACE1 is detected with antibody B279. Antibody A8717, specific to the APP C terminus, was used to detect full-length APP, its CTF99 and CTF83 fragments. Antibodies recognizing β-actin and calnexin were used to verify equal loading.
Figure 6.
Figure 6.
Altered cellular distribution of BACE1 after overexpression of RTN3. A, After transfection with a BACE1-expressing plasmid DNA for 24 h, HEK-293 and HR3M cells were homogenized and a postnuclear supernatant was fractionated on an equilibrium sucrose gradient. Fractions (12 × 1 ml) were collected from the top of the gradient, 400 μl of each fraction was precipitated with ice-cold methanol, and proteins were then separated on 4–12% Bis–Tris NuPAGE gels followed by immunoblotting using antibodies against BACE1 (B279), APP (APP C-terminal), and RTN3 (R458), as indicated. Calnexin, β-COP, TGN38, and EEA1 served as protein markers for the ER, Golgi, trans-Golgi network (TGN), and early endosome (EE), respectively. Molecular weight markers are in kilodaltons and are indicated on the left of the panel. B, HM cells, which stably express BACE1, were transfected with RTN3 or empty vector for 48 h, and cells were subjected to subcellular fractionation via iodixanol gradient. Altered enrichment of BACE1 in the early endosomal compartments is the most prominent. Altered protein bands recognized by APP C-terminal antibody are also indicated with an arrow. This protein fragment was not apparent in the HEK-293 cells, which were used for generation of HM cells. The enrichment of EEA1 (early endosomal marker), β-COP (Golgi compartment marker), and calnexin (ER) was specified.
Figure 7.
Figure 7.
Reduced cell surface BACE1 after overexpression of RTN3. A, The human BACE1-expressing vector was transiently transfected into HEK-293 cells (293) and RTN3-overexpressing HEK-293 cells (HR3M), followed by biotinylation of surface proteins in living cells according to standard procedures. The biotinylated surface proteins were separated from the nonbiotinylated proteins by using neutravidin beads. The total proteins of cell lysates and biotinylated proteins were analyzed on the Western blot using specific antibodies. Three independent experiments were performed on each cell line and analyzed on the same blot. Calnexin served as a loading control. B, C, Total cellular and surface levels of BACE1 (B) and APP (C) were calculated as the integrated density value (IDV) and normalized to the IDV of calnexin. The percentage of the two proteins on the cell surface is presented correspondingly as bar graphs. The results were summarized from three sets of experiments (p < 0.01). D, BACE1-expressing HM cells were transiently transfected with RTN3 plasmid DNA or pcDNA3.1 vector (labeled as vector) for 48 h. The surface protein biotinylation and neutravidin pull-down were performed in the same method, as described above. It is worth noting that without biotinylation, surface proteins were not detectable in the eluates from the neutravidin column. E, F, Total cellular and surface levels of BACE1 (E) and APP (F) were also calculated as IDV and normalized to the IDV of calnexin. The percentage of the two proteins on the cell surface to their total proteins in lysates is correspondingly presented as bar graphs (E) and (F). (n = 6; p < 0.05).

Similar articles

Cited by

References

    1. Bandtlow CE, Dlaska M, Pirker S, Czech T, Baumgartner C, Sperk G. Increased expression of Nogo-A in hippocampal neurons of patients with temporal lobe epilepsy. Eur J Neurosci. 2004;20:195–206. - PubMed
    1. Borchelt DR, Ratovitski T, van Lare J, Lee MK, Gonzales V, Jenkins NA, Copeland NG, Price DL, Sisodia SS. Accelerated amyloid deposition in the brains of transgenic mice coexpressing mutant presenilin 1 and amyloid precursor proteins. Neuron. 1997;19:939–945. - PubMed
    1. Chen MS, Huber AB, van der Haar ME, Frank M, Schnell L, Spillmann AA, Christ F, Schwab ME. Nogo-A is a myelin-associated neurite outgrowth inhibitor and an antigen for monoclonal antibody IN-1. Nature. 2000;403:434–439. - PubMed
    1. Creemers JW, Ines Dominguez D, Plets E, Serneels L, Taylor NA, Multhaup G, Craessaerts K, Annaert W, De Strooper B. Processing of beta-secretase by furin and other members of the proprotein convertase family. J Biol Chem. 2001;276:4211–4217. - PubMed
    1. Dickson TC, King CE, McCormack GH, Vickers JC. Neurochemical diversity of dystrophic neurites in the early and late stages of Alzheimer's disease. Exp Neurol. 1999;156:100–110. - PubMed

Publication types

MeSH terms

LinkOut - more resources