. 2009 Jul 22;29(29):9255-70.
doi: 10.1523/JNEUROSCI.1085-09.2009.

Computational models of millisecond level duration tuning in neural circuits

Affiliations

Computational models of millisecond level duration tuning in neural circuits

Brandon Aubie et al. J Neurosci. .

Abstract

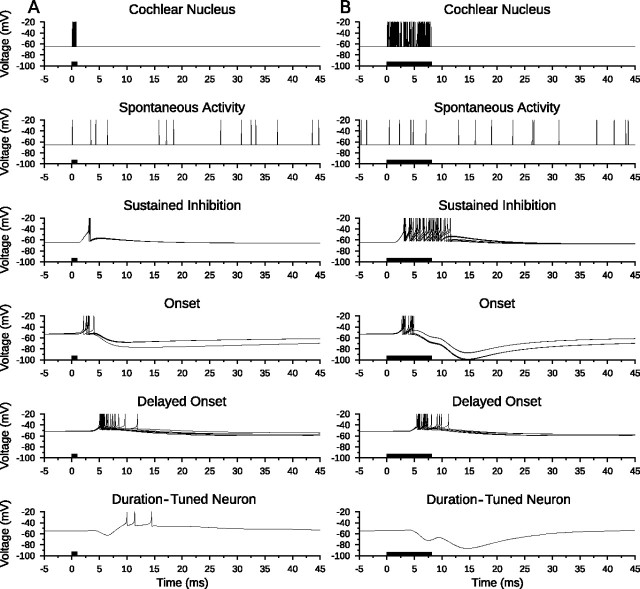
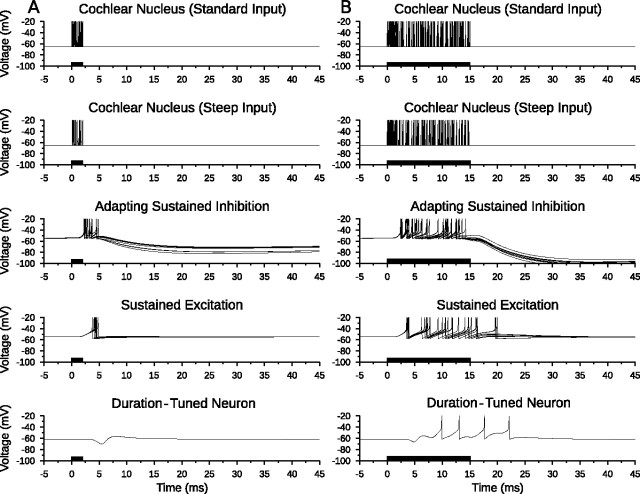
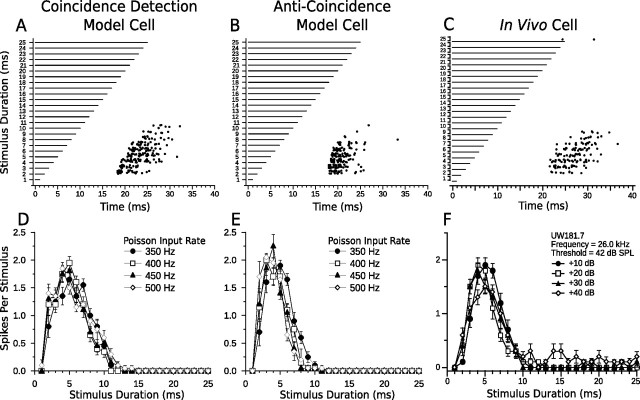
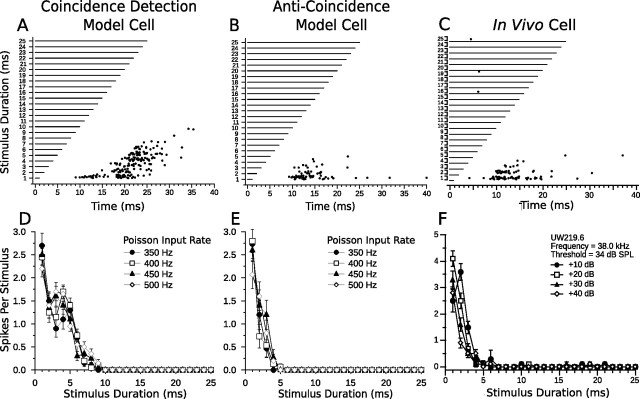
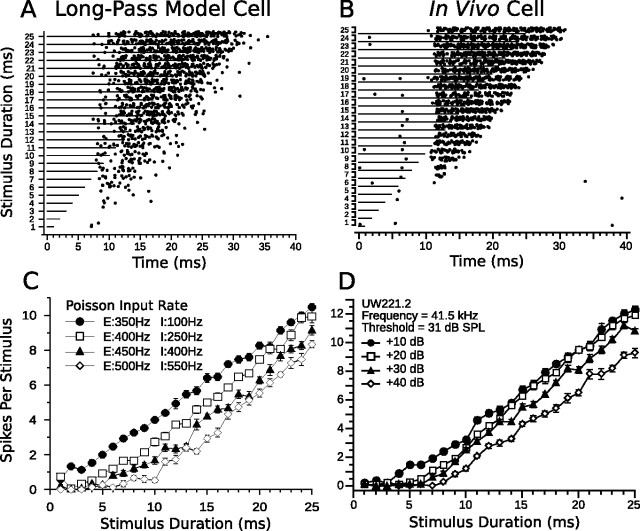
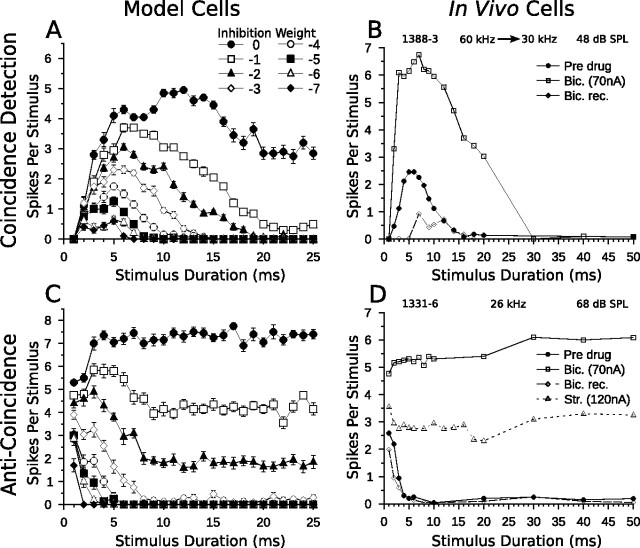
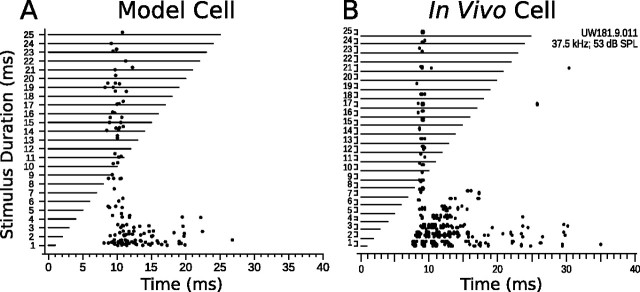
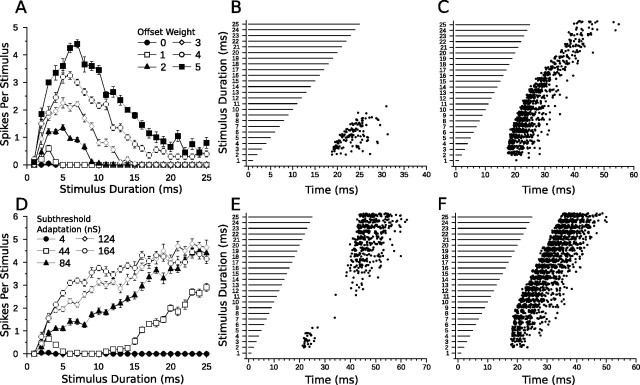
Discrimination of stimulus duration on the order of milliseconds has been observed in behavioral and neurophysiological studies across a variety of species and taxa. Several studies conducted in mammals have found neurons in the auditory midbrain (inferior colliculus) that are selective for signal duration. Duration selectivity in these cells arises from an interaction of excitatory and inhibitory events occurring at particular latencies from stimulus onset and offset. As previously shown in barn owls, coincidence of delayed, excitatory events can be used by the CNS to respond selectively to specific stimuli in auditory space. This study formulates several computational models of duration tuning that combine existing conceptual models with observed physiological responses in the auditory brainstem and midbrain to evaluate the plausibility of the proposed neural mechanisms. The computational models are able to reproduce a wide range of in vivo responses including best duration tuning, duration-selective response classes, spike counts, first-spike latencies, level tolerance to changes in signal amplitude, and neuropharmacological effects of applying inhibitory neurotransmitter antagonists to duration-tuned neurons. A unified model of duration tuning is proposed that enhances classic models of duration tuning, emphasizes similarities across the models, and simplifies our understanding of duration tuning across species and sensory modalities.


Figures

Figure 1.
Figure 1.
Coincidence and anti-coincidence conceptual models for the creation of bandpass, short-pass, and long-pass DTNs. Four traces are shown above each stimulus (black bars). The top traces show the membrane potentials from the summation of synaptic inputs and, if suprathreshold, the spike output of the DTN. The second, third, and bottom traces represent hypothetical synaptic inputs to a DTN. Each model has two or three inputs illustrated as EPSPs or IPSPs: (1) onset-evoked EPSP (ON EPSP; second trace); (2) offset-evoked EPSP (OFF EPSP; third trace; coincidence detection model only); (3) onset-evoked IPSP (ON IPSP; bottom trace). In the coincidence detection model, the DTN spikes only when the ON EPSP coincides with the OFF EPSP. This occurs for the 5 ms stimulus but not for the 1 or 8 ms stimuli. For the 1 ms stimulus, the ON and OFF EPSPs are absent or weak. For the 8 ms stimulus, the ON and OFF EPSPs do not coincide and the ON EPSP is rendered subhreshold by the ON IPSP. In the anti-coincidence models, the DTN spikes only when the ON EPSP does not coincide with the sustained ON IPSP. In the short-pass anti-coincidence model, this occurs for the 1 ms stimulus but not for the 5 or 8 ms stimuli. For the long-pass anti-coincidence model, this occurs only for the 8 ms stimulus. In the long-pass model, the ON EPSP is sustained, whereas the ON IPSP adapts. Suprathreshold EPSPs are illustrated with gray shading. The OFF EPSP is absent in both anti-coincidence models (dashed lines). Models were adapted and modified from Fuzessery and Hall (1999), Faure et al. (2003), and Leary et al. (2008).
Figure 2.
Figure 2.
Model CN afferent input and postsynaptic α-functions. A, PSTH of spike counts for 25 model CN Poisson neurons over 40 trials with a mean firing rate μ0 of 400 Hz. The stimulus occurs from 0 to 20 ms. Each time bin is 1 ms and there are 25 × 40 = 1000 neuron trials per bin, so the spike count can be interpreted as an averaged, instantaneous firing rate in hertz. The onset burst in the CN neurons is easily seen in the first and second bins. B, The α-function of the model with τs = 0.7 ms (EPSP; solid line) and τs = 1.1 ms (IPSP; dashed line) plotted as a function of time since the postsynaptic neuron generated an action potential. A 1 ms delay was added to simulate the axonal delays of each neuron in the circuit. Each function is normalized to an area of 1 before being scaled by q to ensure the same total energy for each spike regardless of τs. Increased or decreased levels of current can be implemented by multiplying the α-functions by a scaling factor (connection weight).
Figure 3.
Figure 3.
Network flow diagrams for three computational models of duration tuning. The rectangles define nuclei of the mammalian central auditory system in which the proposed model components may exist in vivo. The solid lines with filled triangles connecting populations represent EPSPs, and the dashed lines with open triangles represent IPSPs, with connection weights as shown. The ovals represent subpopulations of neurons that share similar response characteristics. Standard Input, Acoustic input implemented as a Poisson spiking process in CN afferents (Fig. 2A); Steep Input, acoustic input to inhibitory components in the long-pass model implemented as a Poisson spiking process with a mean firing rate that grows steeply as stimulus intensity increases; SI, cells that provide sustained inhibition during a stimulus; ON, cells that respond with one or two spikes to stimulus onset; OFF, cells that respond with one or two spikes to stimulus offset via a postinhibitory rebound mechanism; ONdelay, onset cells that respond with one or two spikes after some delay; SIAD, cells that provide adapting sustained inhibition during a stimulus; SE, cells that provide sustained excitation during a stimulus. A, In the bandpass coincidence detection model, the DTN responds only when the stimulus duration results in the production of spikes in the ON cells and EPSPs from the ONdelay and OFF cells coincide. B, In the short-pass anti-coincidence model, the DTN responds only when the EPSP from the ONdelay cells does not coincide with the IPSP from the SI cells. C, In the long-pass anti-coincidence model, the DTN responds only when the EPSP from the SE cells is not suppressed by the adapting IPSP from the SIAD cells.
Figure 4.
Figure 4.
Bandpass coincidence detection duration tuning. Shown are model neuron responses to a single standard input stimulus from the cochlear nucleus at 400 Hz for a duration of 5 ms (A) and 15 ms (B) to illustrate model responses to a BD stimulus and a longer duration stimulus. Membrane potential (voltage) traces of every neuron in the model are shown with action potentials truncated for improved subthreshold clarity. Action potentials from the cochlear nucleus Poisson spiking processes are drawn as instantaneous spikes. A, The duration-tuned neuron produced action potentials when there was a coincidence of spikes from the delayed onset and offset populations. B, When excitations from the delayed onset and offset populations did not coincide, the membrane potential of the DTN remained subthreshold and no action potentials were produced. Stimulus duration is illustrated as black bars on the time axis.
Figure 5.
Figure 5.
Short-pass anti-coincidence duration tuning. Shown are model neuron responses to a single standard input stimulus from the cochlear nucleus at 400 Hz for a duration of 1 ms (A) and 8 ms (B) to illustrate model responses to a BD stimulus and a longer duration stimulus. Spontaneous activity to the DTN from five Poisson spiking processes each with a mean firing rate of 50 Hz is also shown. Membrane potential (voltage) traces of every neuron in the model are shown with action potentials truncated for improved subthreshold clarity. Action potentials from the cochlear nucleus Poisson spiking processes and from spontaneous activity are drawn as instantaneous spikes. A, Excitation from the delayed onset cells was suprathreshold unless it overlapped with inhibition. Therefore, the duration-tuned neuron produced action potentials when there was an anti-coincidence of spikes in the sustained inhibition and delayed onset populations. B, When responses of the delayed onset and sustained inhibition populations overlapped, the membrane potential of the duration-tuned neuron remained subthreshold and no action potentials were produced. Stimulus duration is illustrated as black bars on the time axis.
Figure 6.
Figure 6.
Long-pass anti-coincidence duration tuning. Shown are model neuron responses to a single input stimulus that recruits standard input at 400 Hz and steep input at 250 Hz from the cochlear nucleus to illustrate model responses to a 2 ms (short) stimulus (A) and a 15 ms (long) stimulus (B). Membrane potential (voltage) traces of every neuron in the model are shown with action potentials truncated for improved subthreshold clarity. Action potentials from the cochlear nucleus Poisson spiking processes are drawn as instantaneous spikes. A, Excitation from the sustained excitation cells was suprathreshold unless it overlapped with inhibition. Therefore, the duration-tuned neuron did not fire action potentials when there was a coincidence of spikes from the adapting sustained inhibition and sustained excitation populations. B, When inhibition from the adapting sustained inhibition population decreased, excitation from the sustained excitation population broke through and produced action potentials in the duration-tuned neuron. Note how the membrane potential of the DTN at 7 ms (both stimuli) was raised by excitatory input from the sustained excitation population but did not reach threshold. Sustained excitation neurons driven by the standard cochlear nucleus Poisson spiking process; adapting sustained inhibition neurons driven by the steep cochlear nucleus Poisson spiking process (Fig. 3C). Stimulus duration is illustrated as black bars on the time axis.
Figure 7.
Figure 7.
Comparison of model and in vivo bandpass duration tuning. Shown are dot raster displays of the responses of a bandpass coincidence detection (A) and anti-coincidence (B) model cell to different stimulus durations (20 trials per stimulus; mean Poisson input firing rate, 400 Hz). Model cells have a BD of 5 ms. C, Dot raster display of the responses of an in vivo bandpass DTN with a BD of 5 ms to variable duration pure tones presented at the characteristic frequency of the cell (20 trials per stimulus; 30 dB above threshold). D–F, Mean ± SE spikes per stimulus as a function of stimulus duration (i.e., duration-tuning curves) at four different CN Poisson input firing rates (D, E) or different SPLs relative to threshold (F). Four different Poisson firing rates were chosen to be analogous to four different acoustic SPLs. Refer to Materials and Methods for additional details. Note the response tolerance to changes in stimulus magnitude in both model and in vivo cells. Coincidence detection model responses follow offset of the stimulus more faithfully than anti-coincidence model responses and have a slightly wider temporal bandwidth. C and F were reprinted with permission [Faure et al. (2003), their Fig. 4B].
Figure 8.
Figure 8.
Comparison of model and in vivo short-pass duration tuning. Shown are dot raster displays of the responses of a short-pass coincidence detection (A) and anti-coincidence (B) model cell to different stimulus durations (15 trials per stimulus; mean Poisson input firing rate, 400 Hz). Model cells have a BD of 1 ms. C, Dot raster display of the responses of an in vivo short-pass DTN with a BD of 1 ms to variable duration pure tones presented at the characteristic frequency of the cell (15 trials per stimulus; 30 dB above threshold). D–F, Mean ± SE spikes per stimulus as a function of stimulus duration at four different CN Poisson input firing rates (D, E) or different SPLs relative to threshold (F). Four different Poisson firing rates were chosen to be analogous to four different acoustic SPLs. Refer to Materials and Methods for additional details. Note the response tolerance to changes in stimulus magnitude in both model and in vivo cells. Coincidence detection model DTN has a wider temporal response bandwidth than the anti-coincidence model neuron. C and F were reprinted with permission [Faure et al. (2003), their Fig. 4A].
Figure 9.
Figure 9.
Comparison of model and in vivo long-pass duration tuning. A, Dot raster display of the responses of a long-pass anti-coincidence model cell to different stimulus durations (15 trials per stimulus; mean standard input Poisson firing rate, 400 Hz; mean steep input Poisson firing rate, 250 Hz). B, Dot raster display of the responses of an in vivo long-pass DTN to variable duration pure tones presented at the characteristic frequency of the cell (15 trials per stimulus; 30 dB above threshold). C, D, Mean ± SE spikes per stimulus as a function of stimulus duration at four different CN Poisson input firing rates (C) or different SPLs relative to threshold (D). Four different Poisson firing rates were chosen to be analogous to four different acoustic SPLs. The legend in C lists the standard CN input Poisson firing rates driving the sustained excitation cells (prefaced with an “E”) and the steep CN input Poisson firing rates driving the adapting sustained inhibition cells (prefaced with an “I”). Refer to Materials and Methods for additional details. Note the decreased spike counts of both the model and in vivo long-pass DTNs as the stimulus magnitude increases. B and D were reprinted with permission [Faure et al. (2003), their Fig. 4C].
Figure 10.
Figure 10.
Blocking inhibition in model and in vivo DTNs. Shown are mean ± SE (A, C) and mean spikes per stimulus (B, D) as a function of stimulus duration. A, Duration-tuning curves of a bandpass coincidence detection model neuron (20 trials per stimulus; mean Poisson input firing rate, 400 Hz) with the SI to DTN connection weight varied from −7 to 0 (Fig. 3A). As inhibition decreased, spike counts increased, the BD of the neuron remained fairly stable, and the temporal response bandwidth increased until eventually duration tuning was lost. B, Duration-tuning curves of an in vivo bandpass DTN in response to downward frequency modulated sweeps (60–30 kHz) before, during, and after application of bicuculline, a GABAA antagonist that blocks inhibition. Before drug application (solid circles), the cell had a BD of 5 or 6 ms and did not respond reliably to sounds longer than 14 ms. During application of bicuculline (open squares), spike counts grew considerably, BD remained unchanged, and the temporal response bandwidth increased. C, Duration-tuning curves of a short-pass anti-coincidence model neuron (20 trials per stimulus; mean Poisson input firing rate, 400 Hz) with the SI to DTN connection weight varied from −7 to 0 (Fig. 3B). Once again, as inhibition decreased, spike counts increased and short-pass duration tuning was eventually lost. D, Duration-tuning curves of an in vivo short-pass DTN in response to pure tones (characteristic frequency, 26 kHz) at varying stimulus durations before (closed circles), during (open squares), and after (open diamonds) application of bicuculline, and during application of strychnine, a glycine antagonist (open triangles). When inhibition was blocked, spike counts increased considerably and duration tuning was eventually abolished. B and D were reprinted with permission [Casseday et al. (2000), their Figs. 5A, 2A].
Figure 11.
Figure 11.
Onset excitation breakthrough in model and in vivo DTNs. A, Dot raster display of an onset breakthrough response in a short-pass anti-coincidence model neuron (BD, 1 ms) with the SI to DTN connection weight decreased from −5 to −4.3 and the SI to DTN axonal delay increased from 1 to 2.8 ms (15 trials per stimulus; mean Poisson input firing rate, 400 Hz). B, Dot raster display of an onset breakthrough response in an in vivo short-pass DTN (BD, 1 ms; 15 trials per stimulus; 30 dB above threshold). B was reprinted with permission [Faure et al. (2003), their Fig. 6B].
Figure 12.
Figure 12.
Offset excitation in the bandpass coincidence detection model. A, Mean ± SE duration-tuning curves of a bandpass coincidence detection model cell with the OFF to DTN connection weight varied from 0 to 5 (Fig. 3A) and a mean Poisson input rate of 400 Hz (20 trials per stimulus). B, C, Dot raster displays showing responses of the bandpass coincidence model with the OFF to DTN connection weight set to 2 (B) and 5 (C). D, Mean ± SE duration-tuning curves of a bandpass coincidence model with postinhibitory rebound and increasing levels of subthreshold adaptation in the model neuron (see Results, Relevance of model components). E, F, Dot raster displays showing responses of the bandpass coincidence model with postinhibitory rebound and subthreshold adaptation levels of 44 nS (E) and 164 nS (F). In E, note the bimodal pattern of action potentials. The model cell reliably spiked in response to stimulus durations between 2 and 4 ms and at durations >15 ms. The band-reject selectivity resulted from the failure of the model cell to produce spikes from postinhibitory rebound at short durations unless the rebound coincided with the onset-evoked excitation; however, at longer durations, the rebound was strong and spikes were produced in the model DTN. In F, the high level of subthreshold adaptation allowed the model cell to spike via postinhibitory rebound at all but the shortest duration; hence the cell lost its duration selectivity.
Figure 13.
Figure 13.
Mean ± SE first-spike latencies of the coincidence detection, anti-coincidence (A), and long-pass (B) duration-tuning models. A, Responses of the coincidence and anti-coincidence model cells followed the offset of the stimulus. In the anti-coincidence models, the sustained inhibition to the model DTN caused a longer first-spike latency even though the onset-evoked EPSP arrived at approximately the same time at all durations. The coincidence detection models followed signal offset more reliably than the anti-coincidence models (see Results, Relevance of model components). B, First-spike latencies of the long-pass model at four Poisson input firing rates. Note how first-spike latency increased with stimulus magnitude at durations ca. ≥6 ms. Action potentials occurred less frequently and with more variable timing at shorter durations (Fig. 9). Each model was run 20 times with a mean Poisson input rate of 400 Hz (A) or as shown in the legend (B).

References

    1. Brand A, Urban R, Grothe B. Duration tuning in the mouse auditory midbrain. J Neurophysiol. 2000;84:1790–1799. - PubMed
    1. Brette R, Gerstner W. Adaptive exponential integrate-and-fire model as an effective description of neuronal activity. J Neurophysiol. 2005;94:3637–3642. - PubMed
    1. Buhusi CV, Meck WH. What makes us tick? Functional and neural mechanisms of interval timing. Nat Rev Neurosci. 2005;6:755–765. - PubMed
    1. Buonomano DV, Maass W. State-dependent computations: spatiotemporal processing in cortical networks. Nat Rev Neurosci. 2009;10:113–125. - PubMed
    1. Carr CE, Konishi M. A circuit for detection of interaural time differences in the brainstem of the barn owl. J Neurosci. 1990;10:3227–3246. - PMC - PubMed

Publication types

MeSH terms

Substances

LinkOut - more resources