. 2009 Jul 22;29(29):9301-13.
doi: 10.1523/JNEUROSCI.1367-09.2009.

Retina-specific GTPase accelerator RGS11/G beta 5S/R9AP is a constitutive heterotrimer selectively targeted to mGluR6 in ON-bipolar neurons

Affiliations

Retina-specific GTPase accelerator RGS11/G beta 5S/R9AP is a constitutive heterotrimer selectively targeted to mGluR6 in ON-bipolar neurons

Yan Cao et al. J Neurosci. .

Abstract

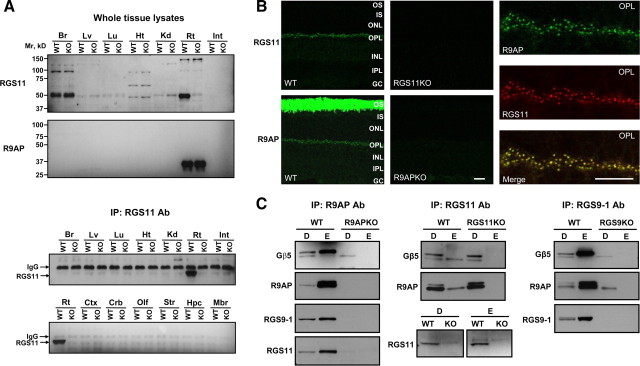
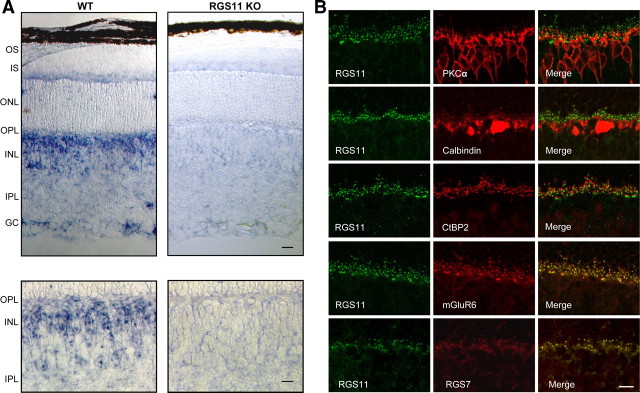
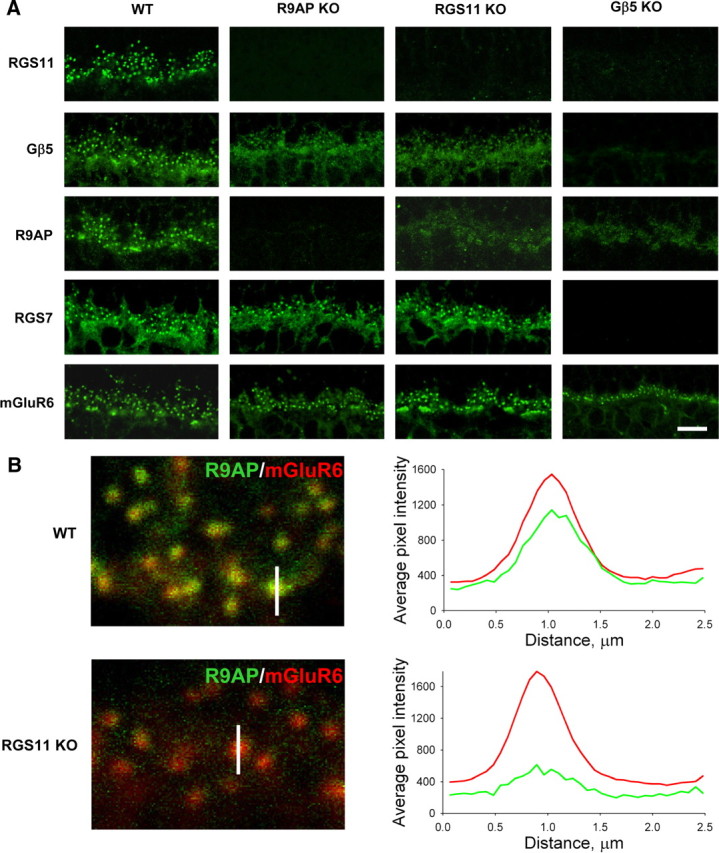
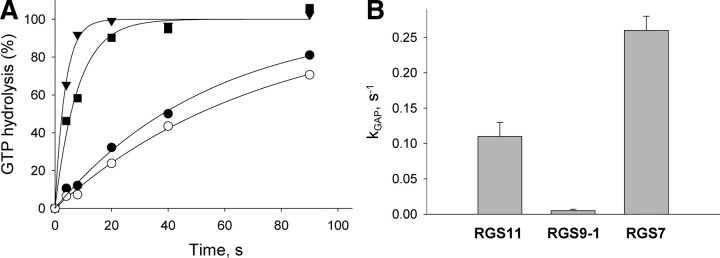
Members of the R7 family of the regulators of G-protein signaling (R7 RGS) proteins form multi-subunit complexes that play crucial roles in processing the light responses of retinal neurons. The disruption of these complexes has been shown to lead to the loss of temporal resolution in retinal photoreceptors and deficient synaptic transmission to downstream neurons. Despite the well established role of one member of this family, RGS9-1, in controlling vertebrate phototransduction, the roles and organizational principles of other members in the retina are poorly understood. Here we investigate the composition, localization, and function of complexes containing RGS11, the closest homolog of RGS9-1. We find that RGS11 forms a novel obligatory trimeric complex with the short splice isoform of the type 5 G-protein beta subunit (G beta 5) and the RGS9 anchor protein (R9AP). The complex is expressed exclusively in the dendritic tips of ON-bipolar cells in which its localization is accomplished through a direct association with mGluR6, the glutamate receptor essential for the ON-bipolar light response. Although association with both R9AP and mGluR6 contributed to the proteolytic stabilization of the complex, postsynaptic targeting of RGS11 was not determined by its membrane anchor R9AP. Electrophysiological recordings of the light response in mouse rod ON-bipolar cells reveal that the genetic elimination of RGS11 has little effect on the deactivation of G alpha(o) in dark-adapted cells or during adaptation to background light. These results suggest that the deactivation of mGluR6 cascade during the light response may require the contribution of multiple GTPase activating proteins.


Figures

Figure 1.
Figure 1.
Characterization of RGS11 expression and its complex formation with Gβ5 and R9AP subunits. A, Top, Western blot analysis of RGS11 and R9AP protein expression in whole-tissue lysates prepared from different tissues. Tissues were lysed in buffer containing 1% Triton X-100 as described in Materials and Methods, and 5 μg of total protein was loaded in each lane after supplementation with SDS sample buffer. Equal amount of lysate prepared from RGS11 knock-out tissues (KO) served as a control for nonspecific cross-reactivity of sheep anti-RGS11 CT antibodies used to probe the blot. In parallel, an identical blot was probed with rabbit anti-R9AP antibodies. Bottom, Detection of RGS11 protein expression in various tissues and brain regions by Western blotting after immunoprecipitation. Five micrograms of sheep anti-RGS11 CT antibodies was used for the immunoprecipitation (IP) experiment, and the blots were probed with rabbit anti-RGS11 CT antibodies. Br, Brain; Lv, liver; Lu, lung; Ht, heart; Kd, kidney; Rt, retina; Int, intestine; Ctx, cortex; Crb, cerebellum; Olf, olfactory bulb; Str, striatum; Hpc, hippocampus; Mbr, midbrain. B, Colocalization of RGS11 and R9AP at the outer plexiform layer in the retina. Retinal sections prepared from wild-type (WT) and knock-out mice were stained using rabbit anti-RGS11 CT and anti-R9AP antibodies. Immunofluorescence signals overlapped extensively in the outer plexiform layer. OS, Outer segment; IS, inner segment; ONL, outer nuclear layer; OPL, outer plexiform layer; INL, inner nuclear layer; IPL, inner plexiform layer; GC, ganglion cells. Scale bars: left, 20 μm; right, 10 μm. C, Coimmunoprecipitation of RGS11 with its subunits: R9AP and Gβ5S. Total retina lysates prepared as described in Materials and Methods were subjected to immunoprecipitation with indicated antibodies. Proteins preset in whole-cell detergent extracts (D) and eluates from the beads (E) were detected by Western blotting with antibodies against individual proteins.
Figure 2.
Figure 2.
RGS11 is specifically expressed in ON-bipolar cells. A, In situ hybridizations using a riboprobe for RGS11 were performed on wild-type (WT) and RGS11 knock-out (RGS11 KO) retinas as described in Materials and Methods. Abbreviations are the same as in Figure 1. Scale bars: top, 20 μm; bottom, 10 μm. B, Colocalization of RGS11 (green) with marker protein (red) labeling: bipolar cells (PKCα), horizontal cells (calbindin), photoreceptor presynaptic ribbon (CtBP2), and tips of ON-bipolar cell dendrites (mGluR6 and RGS7). Overlapping signals appear as yellow fluorescence in the combined channel (merge). Scale bar, 10 μm.
Figure 3.
Figure 3.
Contributions of individual subunits of RGS11/Gβ5S/R9AP complex to its synaptic accumulation. A, Immunohistochemical analysis of RGS11, Gβ5, and R9AP localization in the outer plexiform layer of the retinas from mice with targeted disruption of RGS11, Gβ5, and R9AP genes. Localization of mGluR6 and RGS7 proteins served as control reference points. Tissue processing and imaging was performed as described in Materials and Methods. Scale bar, 10 μm. B, Analysis of the R9AP immunofluorescence distribution in the outer plexiform layers of wild-type (WT) and RGS11 knock-out (KO) retinas. Retinas were double stained for mGluR6 (red) and R9AP (green), imaged, and processed by MetaMorph software. A line of 2.48 μm (white bar) was drawn through the center of the distinct mGluR6-positive synapses, and the distribution of the fluorescence intensity along this line was scanned to generate profiles shown to the right, in which red traces correspond to mGluR6 fluorescence and green to R9AP. Shown traces are average of 10 intensity scans within a single section. Parameters of the fluorescence peaks across multiple sections from several mice are presented in supplemental Table 1 (available at www.jneurosci.org as supplemental material).
Figure 4.
Figure 4.
Mutations in mGluR6 prevent synaptic integration of ON-bipolar dendrites and abolish postsynaptic accumulation of RGS11/Gβ5S/R9AP. A, Immunohistochemical analysis of protein localization at outer plexiform layer of nob4 mice. Indicated proteins were immunostained by specific antibodies. Retinas of wild-type (WT) and nob4 mice were processed simultaneously, and images were acquired with the same exposure settings. Scale bar, 10 μm. B, Immunohistochemical analysis of the presynaptic (CtBP2) and postsynaptic (Gαo) marker apposition in the retinas of wild-type and nob4 mice. Scale bar, 10 μm. C, Comparison of the morphology of synapses between rods and horizontal/bipolar cells by electron microscopy. High magnification of the synapses of wild-type and nob4 retinas reveals the absence of the bipolar cell (BC) dendrites from the rod terminals that at the same time contained intact ribbon (*) and horizontal cell dendrites (HC). Right, Quantification of synapses with all three identifiable features. Quantification results are based on preparations obtained from two separate mice for each genotype. The numbers of the counted synaptic triads in which both horizontal cell dendrites and ribbons were identified are reported on the graph.
Figure 5.
Figure 5.
Coimmunoprecipitation of mGluR6 with RGS11/Gβ5S/R9AP complex. HEK293T cells were transfected with the indicated constructs and 48 h later were lysed in a buffer containing 0.5% of n-dodecanoylsucrose. RGS11 antibodies were used for immunoprecipitation (IP) as described in Materials and Methods. Eluted proteins were detected by Western blotting using specific antibodies. Cells expressing all of the constructs except RGS11 served as a control for the nonspecific binding.
Figure 6.
Figure 6.
Elimination of mGluR6 specifically reduces RGS11 expression at the posttranscriptional level. A, Western blot analysis of protein expression in the retinas of wild-type (WT), nob3, and nob4 mice. Total retina lysates (8.5 μg) were loaded in each lane. Blots were probed with indicated antibodies as described in Materials and Methods. B, Quantification of the Western blotting data. Band densities of indicated proteins were determined by NIH ImageJ software and normalized to levels of β-actin present in the same sample. Samples from three to eight retinas were used in the analysis. Error bars are SEM values. **p < 0.01. C, Quantitative RT-PCR determination of RGS11 mRNA levels. Relative level of RGS11 mRNAs was measured by quantitative RT-PCR and normalized to the level of β-actin mRNA amplified in parallel as an endogenous reference. Relative quantification algorithm was used in which changes in amplification threshold were normalized to sample from wild-type mice. Data are averaged from three separate groups of animals. KO, Knock-out.
Figure 7.
Figure 7.
R9AP and mGluR6 contribute to the proteolytic stability of RGS11/Gβ5S. A, Pulse-chase labeling of RGS11. NG108-15 cells transiently transfected with RGS11, Gβ5S with or without R9AP, or mGluR6. Cells were labeled by 35SMet/Cys as described in Materials and Methods. The label was removed and replaced with fresh media containing nonradioactive amino acids. Cells were collected at the indicated time points during the chase and frozen in liquid nitrogen. After disruption of the cells, RGS11 was immunoprecipitated using specific antibodies and resolved on an SDS-PAGE gel. The gel was subjected to autoradiography to reveal the radiolabeled RGS11. B, Left, Time course of RGS11/Gβ5S degradation. Intensities of radioactive bands were quantified using ImageQuant software and plotted as a function of time. The experimental points were fitted by single exponents. The data presented in the figure are representative of two or three independently conducted experiments. C, Comparison of the RGS11/Gβ5S degradation half-time in the absence or presence of R9AP and mGluR6. The values were derived from single-exponential analysis of the degradation time course (B). Error bars represent SEM values. *p < 0.05.
Figure 8.
Figure 8.
Analysis of the RGS11/Gβ5S GAP activity. A, Time courses of the GTP hydrolysis on Gαo, in the absence of RGS proteins (○) or in the presence of RGS11/Gβ5S (■), RGS7/Gβ5S (▾), or RGS9-1/Gβ5L and PDEγ (·). Individual time points were normalized to maximal GTP hydrolysis and plotted as a function of time. Data were fitted with single exponent that was used to determine the rate constant of the reaction. The experiment shown is representative of three experiments yielding similar results. B, kGAP values were calculated by subtracting the basal unstimulated rate constant of GTP hydrolysis from the RGS-stimulated rates. Errors bars are SEM values.
Figure 9.
Figure 9.
Light responses of rod bipolar cells in RGS11 knock-out mice. A, Light-evoked inward currents in dark-adapted rod bipolar cells were plotted as a function of time for brief flashes (arrow) of 0.38, 0.76, 1.5, 3.1, 6.1, 12, and 24 Rh*/rod, and in light-adapted (100 R*/s/rod) cells for brief flashes (arrow) of 1.1, 2.3, 4.6, 9.2, 18, and 37 Rh*/rod. The bandwidth was 50 Hz. B, The estimated responses per photon plotted as a percentage of maximum inward current for dark-adapted and light-adapted cells. The dark-adapted wild-type (WT) response (solid) was the average of 547 responses from 5–25% of the saturating response (Sampath et al., 2005) across 23 rod bipolar cells. The dark-adapted RGS11 knock-out (KO) response (dotted) was the average of 570 responses across 22 rod bipolar cells. The light-adapted wild-type response (solid) was the average of 130 responses from 5–35% of the saturating response across nine rod bipolar cells. The light-adapted RGS11 knock-out response (dotted) was the average of 140 responses across nine rod bipolar cells. C, Response–intensity relationship across all dark-adapted rod bipolar cells in wild-type (n = 23) and RGS11 knock-out (n = 22) mice. Data were plotted as a mean ± SD, and the least-squares Hill curve fits to the mean and SDs are superimposed. For wild-type rod bipolar cells, I1/2 = 2.4 Rh*/rod, and n = 1.58 (solid). For RGS11 knock-out rod bipolar cells, I1/2 = 2.5 Rh*/rod, and n = 1.66 (dotted). The difference in these fit parameters is not statistically significant. D, Gain changes in background light (100 R*/rod/s) were calculated and plotted for individual rod bipolar cells as in the study of Dunn et al. (2006). Gain normalized to gain in darkness was 0.24 ± 0.07 (n = 9) for wild-type cells (filled) and 0.26 ± 0.10 (n = 9) for RGS11 knock-out cells (open).

Similar articles

Cited by

References

    1. Anderson GR, Semenov A, Song JH, Martemyanov KA. The membrane anchor R7BP controls the proteolytic stability of the striatal specific RGS protein, RGS9–2. J Biol Chem. 2007a;282:4772–4781. - PubMed
    1. Anderson GR, Lujan R, Semenov A, Pravetoni M, Posokhova EN, Song JH, Uversky V, Chen CK, Wickman K, Martemyanov KA. Expression and localization of RGS9–2/G 5/R7BP complex in vivo is set by dynamic control of its constitutive degradation by cellular cysteine proteases. J Neurosci. 2007b;27:14117–14127. - PMC - PubMed
    1. Baker SA, Haeri M, Yoo P, Gospe SM, 3rd, Skiba NP, Knox BE, Arshavsky VY. The outer segment serves as a default destination for the trafficking of membrane proteins in photoreceptors. J Cell Biol. 2008;183:485–498. - PMC - PubMed
    1. Ballon DR, Flanary PL, Gladue DP, Konopka JB, Dohlman HG, Thorner J. DEP-domain-mediated regulation of GPCR signaling responses. Cell. 2006;126:1079–1093. - PubMed
    1. Blundell J, Hoang CV, Potts B, Gold SJ, Powell CM. Motor coordination deficits in mice lacking RGS9. Brain Res. 2008;1190:78–85. - PMC - PubMed

Publication types

MeSH terms