. 2009 Jul 22;29(29):9351-60.
doi: 10.1523/JNEUROSCI.1744-09.2009.

Coordination of rhythmic motor activity by gradients of synaptic strength in a neural circuit that couples modular neural oscillators

Affiliations

Coordination of rhythmic motor activity by gradients of synaptic strength in a neural circuit that couples modular neural oscillators

Carmen Smarandache et al. J Neurosci. .

Abstract

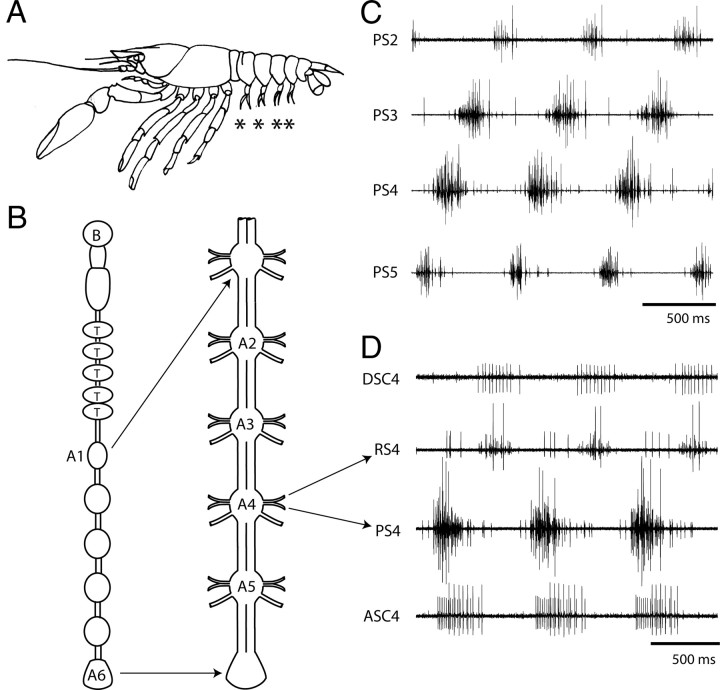
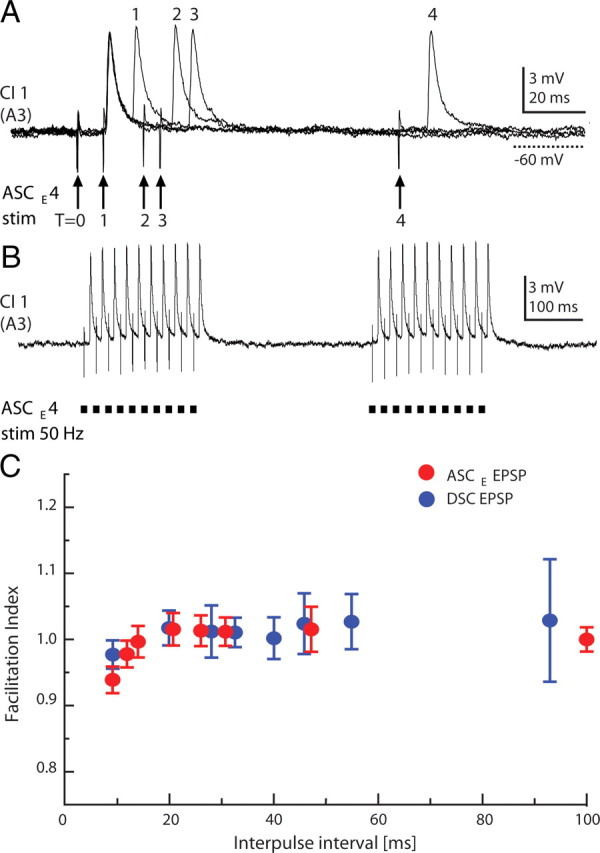
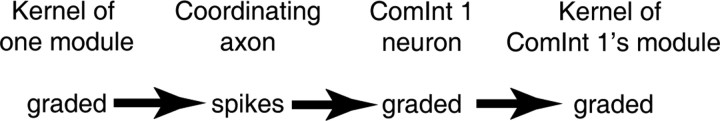
Synchronization of distributed neural circuits is required for many behavioral tasks, but the mechanisms that coordinate these circuits are largely unknown. The modular local circuits that control crayfish swimmerets are distributed in four segments of the CNS, but when the swimmeret system is active their outputs are synchronized with a stable intersegmental phase difference of 0.25, an example of metachronal synchronization (Izhikevich, 2007). In each module, coordinating neurons encode detailed information about each cycle of the module's motor output as bursts of spikes, and their axons conduct this information to targets in other segments. This information is both necessary and sufficient for normal intersegmental coordination. In a comprehensive set of recordings, we mapped the synaptic connections of two types of coordinating neurons onto their common target neurons in other segments. Both types of coordinating axons caused large, brief EPSPs in their targets. The shape indices of these EPSPs are tuned to transmit the information from each axon precisely. In each target neuron's own module, these bursts of EPSPs modified the phase of the module's motor output. Each axon made its strongest synapse onto the target neuron in the nearest neighboring segment. Its synapses onto homologous targets in more remote segments were progressively weaker. Each target neuron decodes information from several coordinating axons, and the strengths of their synapses differ systematically. These differences in synaptic strength weight information from each segment differently, which might account for features of the system's characteristic metachronal synchronization.


Figures

Figure 1.
Figure 1.
Anatomy and physiology of the crayfish swimmeret system. A, A lateral view of a crayfish showing the four swimmerets (asterisks). B, Diagrams of the CNS. The six abdominal ganglia are expanded to show the four swimmeret ganglia, A2 through A5. B, Brain; T, thoracic ganglia. A6, The terminal abdominal ganglia. C, Simultaneous recordings from PS branches of the swimmeret nerves from ganglia A2 (PS2), A3 (PS3), A4 (PS4), and A5 (PS5) that show three cycles of bursts of spikes in PS axons. Each cycle begins with a burst on PS5, and progresses anteriorly with a phase difference of ∼0.25 between each ganglion. D, Simultaneous extracellular recordings from coordinating axons (ASC4, DSC4) and PS and RS branches from A4 (arrows). ASCE spikes are the smaller of the two sizes on ASC4, and occur simultaneously with the PS burst. DSC bursts occur simultaneously with RS bursts. These four traces illustrate three cycles of output from one module.
Figure 2.
Figure 2.
Neurons in the swimmeret coordinating circuit and diagrams of the system. These confocal stacks of whole mount preparations show entire ganglia, viewed from the dorsal side with anterior at the top. A, One ASCE and one ASCL neuron whose axons project from the lateral neuropil (LN) to exit the ganglion anteriorly. ASCL neurons are not parts of the circuit discussed in this paper (Mulloney et al., 2006; Mulloney and Hall, 2007b). B, A DSC neuron whose axon projects posteriorly. C, A ComInt 1 neuron with its cell body near the ganglion's right margin whose neurite crosses the midline (mid), extends a tuft of small branches, and continues to the opposite LN. D, A DSC axon filled in a ganglion posterior to its home ganglion. ASCE axons course through the ganglia in the same tracts, and they have similar structures. E, In each swimmeret segment (2, 3, 4, 5), a bilateral pair of local circuits (∼) control the firing of pools of PS and RS motor neurons that innervate each swimmeret. F, From each local circuit, axons of two coordinating neurons project anteriorly (ASCE) or posteriorly (DSC) to the other ganglia. Here and in subsequent diagrams, only one side of the CNS or ganglion is illustrated. G, Within each local circuit, in this case ∼4, the ASCE neuron and DSC neuron that originate there and project axons to other segments are driven by the same pattern-generating kernel that controls the swimmeret motor neurons (PS4, RS4). This kernel is composed of two sets of reciprocally inhibitor local interneurons (1, 2). Axons of ASCE and DSC neurons projecting from neighboring segments synapse onto commissural interneuron 1 (C1), which integrates the information they conduct and affects the oscillations of the module's kernel. In these diagrams, solid black circles symbolize inhibitory synapses, triangles symbolize excitatory synapses, the colors identify the segments in which axons originate, and arrows mark the direction of orthodromic impulse conduction.
Figure 3.
Figure 3.
PRCs of PS bursts in response to current pulses delivered to the ComInt 1 neuron that projects to the same module (Fig. 2G). These plots illustrate results of one experiment in which we used depolarizing current pulses (A) and then hyperpolarizing pulses (B) to perturb the same ComInt 1 neuron. Normalized period difference is the difference between the measured period and the mean period, divided by the mean period (Mulloney and Hall, 2007a). Positive values mean longer periods, negative values mean shorter periods. The solid lines are smoothed fits of normalized period differences to phase of the stimulus pulse. The dashed line indicates no change in response to the stimulus. The gray bars near the bottom represent the interval when the module's PS motor neurons are firing. C, These box plots describe two cycles of a normal swimmeret motor pattern in three ganglia (Ai−1, Ai, Ai+1), and show when each type of neuron fires. The PS boxes show the posterior-to-anterior progression of PS bursts in neighboring ganglia (Fig. 1C). Spikes in coordinating axons travel anteriorly from the next posterior ganglion (ASCEi+1) and posteriorly from the next anterior ganglion (DSCi−1). Because of the 0.25 phase difference between PS bursts in neighboring ganglia and the timing of ASCE and DSC bursts relative to PS bursts in their home modules (Fig. 1D), bursts of spikes in ASCEi+1 and DSCi−1 axons arrive simultaneously at the ComInt 1 neuron in ganglion Ai.
Figure 4.
Figure 4.
Recordings of postsynaptic potentials and currents in a ComInt 1 neuron in ganglion A2, the most anterior swimmeret ganglion. A, A diagram that shows the positions of recording electrodes. CI 1, An intracellular microelectrode in ComInt 1 at the midline of the ganglion, where this neuron receives synaptic input from coordinating axons (Fig. 2C, D). ASCE3, Extracellular recording from an ASCE axon originating in ganglion A3. B, Simultaneous recordings of EPSPs in an A2 ComInt 1 neuron and a burst of spikes in ASCE3 during expression of the swimmeret motor pattern (Fig. 1C, D). C, Simultaneous recordings of bursts of spikes in ASCE3 and PSCs they cause in a second A2 ComInt 1. D, Multiple recordings triggered from ASCE3 spikes show the time-locked PSCs in this ComInt 1 neuron.
Figure 5.
Figure 5.
Postsynaptic potentials and currents recorded in a ComInt 1 neuron in ganglion A5, the most posterior swimmeret ganglion. A, A diagram showing positions of recording electrodes. CI 1, An intracellular microelectrode in ComInt 1 at the midline of the ganglion, where this neuron receives synaptic input from coordinating axons from other ganglia. DSC4, Extracellular recording from the DSC axon originating in ganglion A4. B, Simultaneous recordings of EPSPs in an A5 ComInt 1 neuron and a burst of spikes in DSC4. C, Simultaneous recordings of bursts of spikes in DSC4 and the PSCs these spikes cause in an A5 ComInt 1 neuron. D, Multiple recordings triggered by DSC4 spikes show the time-locked PSCs in this A5 ComInt 1.
Figure 6.
Figure 6.
Segmental differences in the patterns and strengths of synaptic connections between coordinating axons and ComInt 1 neurons. A, D, G, J, Diagrams that show positions of recording electrodes. Labels are the same as for Figures 4 and 5. B, E, H, K, Diagrams that summarize patterns of synaptic connections onto ComInt 1 (CI1) neurons in ganglia A2, A3, A4, and A5. Triangles symbolize excitatory synapses. C, Simultaneous recordings of spikes in ASCE3, ASCE4, and ASCE5 and their EPSPs in the A2 ComInt 1 neuron. The strongest EPSPs came from ASCE3. ComInt 1 neurons in A2 receive no input from DSC neurons (Mulloney et al., 2006). F, Simultaneous recordings spikes in DSC2, ASCE4, and ASCE5 and their EPSPs in the A3 ComInt 1. I, Simultaneous recordings of spikes in DSC2, DSC3, and ASCE5 axons and their EPSPs in the A4 ComInt 1 neuron. The strongest EPSPs come from ASCE5. L, Simultaneous recordings of spikes in DSC2, DSC3, and DSC4 axons and their EPSPs in the A5 ComIn1 1 neuron. The strongest EPSPs came from DSC4. ComInt 1 neurons in A5 receive no input from ASCE axons that originate in other modules (Mulloney et al., 2006).
Figure 7.
Figure 7.
Absence of short-term plasticity in synapses between coordinating axons and ComInt 1 neurons. A, Paired-pulse stimulation of one ASCE axon and simultaneous recordings of EPSPs in the ComInt 1 neuron in its neighboring ganglion. In these four overlaid recordings, T = 0 marks the first pulse of each pair. 1, 2, 3, and 4 mark second pulses, delayed respectively by 8, 20, 25, and 100 ms, and the EPSPs they elicited. B, Two trains of stimuli at 50 Hz. C, In this experiment, EPSPs elicited by stimulating identified ASCE and DSC axons were recorded in the same ComInt 1 neuron. The facilitation index (ratio of the second EPSP's amplitude to the first EPSP's amplitude) of pairs of ASCE and DSC EPSPs did not vary significantly with interpulse interval. Data points are means ± SD.
Figure 8.
Figure 8.
A diagram illustrating the transformation of information from graded synaptic transmission within one local circuit into bursts of spikes in an intersegmental coordinating axon and then, through integration in a ComInt 1 neuron, back into a graded transient depolarization that affects graded transmission to the kernel of the ComInt 1 neuron's target module.
Figure 9.
Figure 9.
Diagrams of the synaptic organization of the intersegmental coordinating circuit in each swimmeret ganglion, A2, A3, A4, and A5. In each module, a ComInt 1 neuron (C1) integrates bursts of EPSPs from coordinating axons, transmits this information to neurons in the local pattern-generating circuit, and so adjusts the timing of the module's next PS burst. Symbols and colors are the same as in Figure 2. Different sizes of triangles indicate relative strengths of synapses. Arrows indicate the direction of impulse traffic in coordinating axons.

Similar articles

Cited by

References

    1. Canavier CC. Phase response curve. Scholarpedia. 2006;1:1332.
    1. Cang J, Friesen WO. Model for intersegmental coordination of leech swimming: central and sensory mechanisms. J Neurophysiol. 2002;87:2760–2769. - PubMed
    1. Davis WJ. The neuromuscular basis of lobster swimmeret beating. J Exp Zool. 1968;168:363–378.
    1. Friesen WO, Cang JH. Sensory and central mechanisms control intersegmental coordination. Curr Opin Neurobiol. 2001;11:678–683. - PubMed
    1. Grillner S. Control of locomotion in bipeds, tetrapods and fish. In: Brooks VB, editor. Handbook of physiology, the nervous system. Vol 2. Baltimore: Williams and Wilkens; 1981. pp. 1179–1236. Motor control.

Publication types