. 2009 Jul 22;29(29):9370-9.
doi: 10.1523/JNEUROSCI.0143-09.2009.

Slowly adapting mechanoreceptors in the borders of the human fingernail encode fingertip forces

Affiliations

Slowly adapting mechanoreceptors in the borders of the human fingernail encode fingertip forces

Ingvars Birznieks et al. J Neurosci. .

Abstract

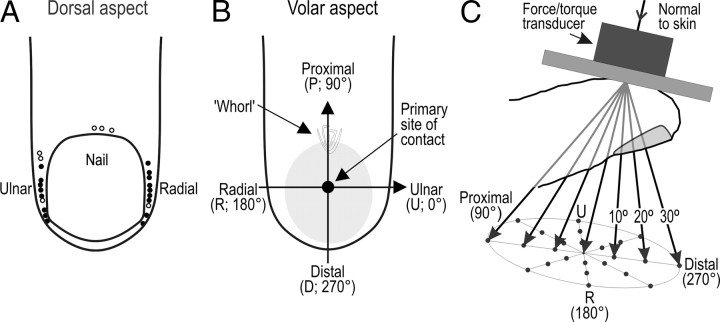
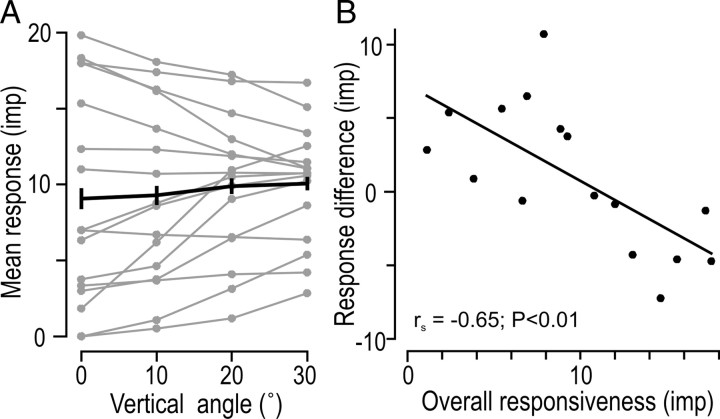
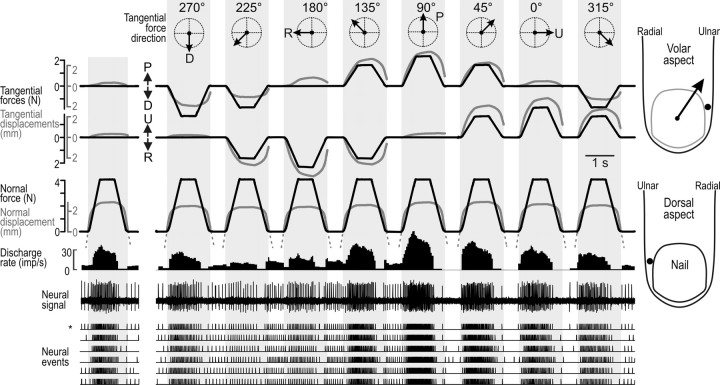
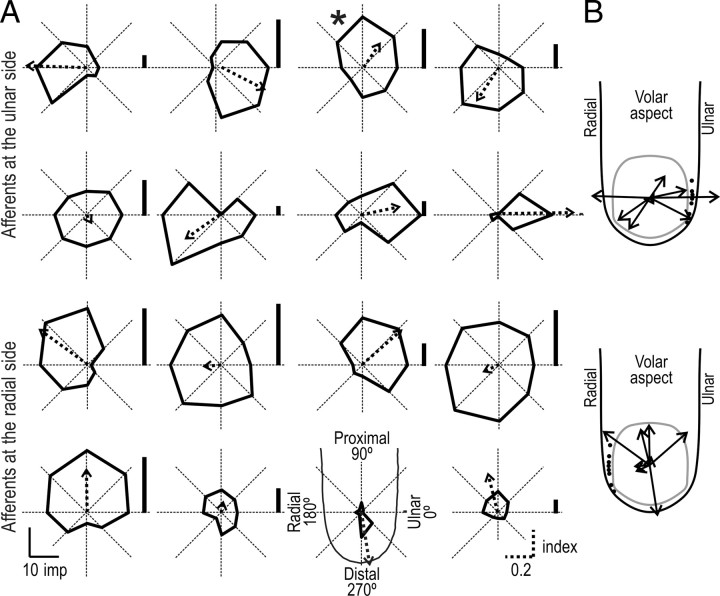
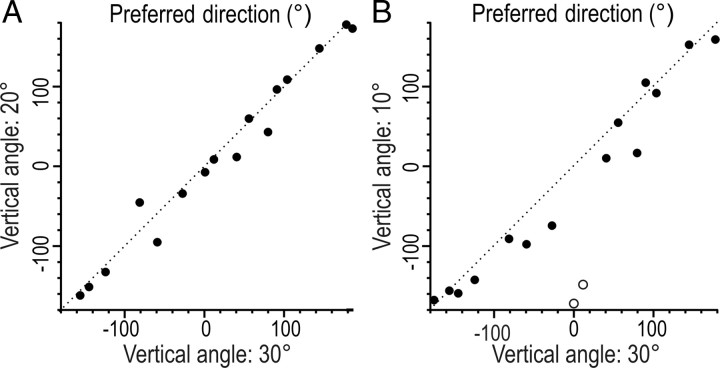
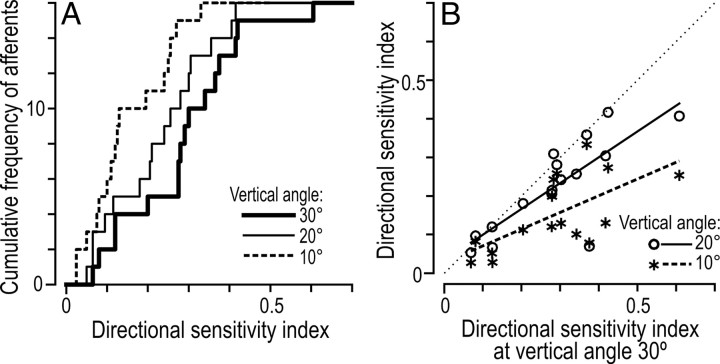
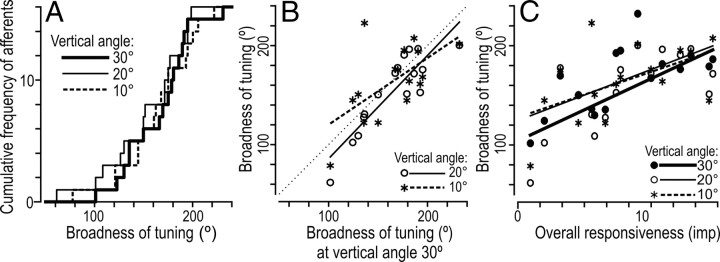
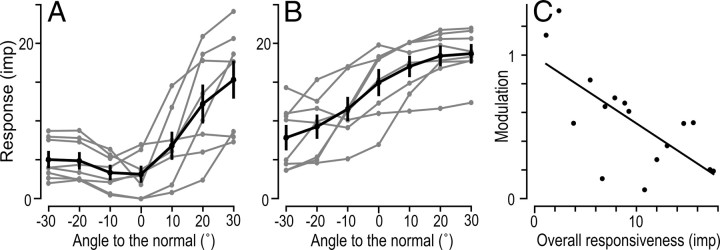
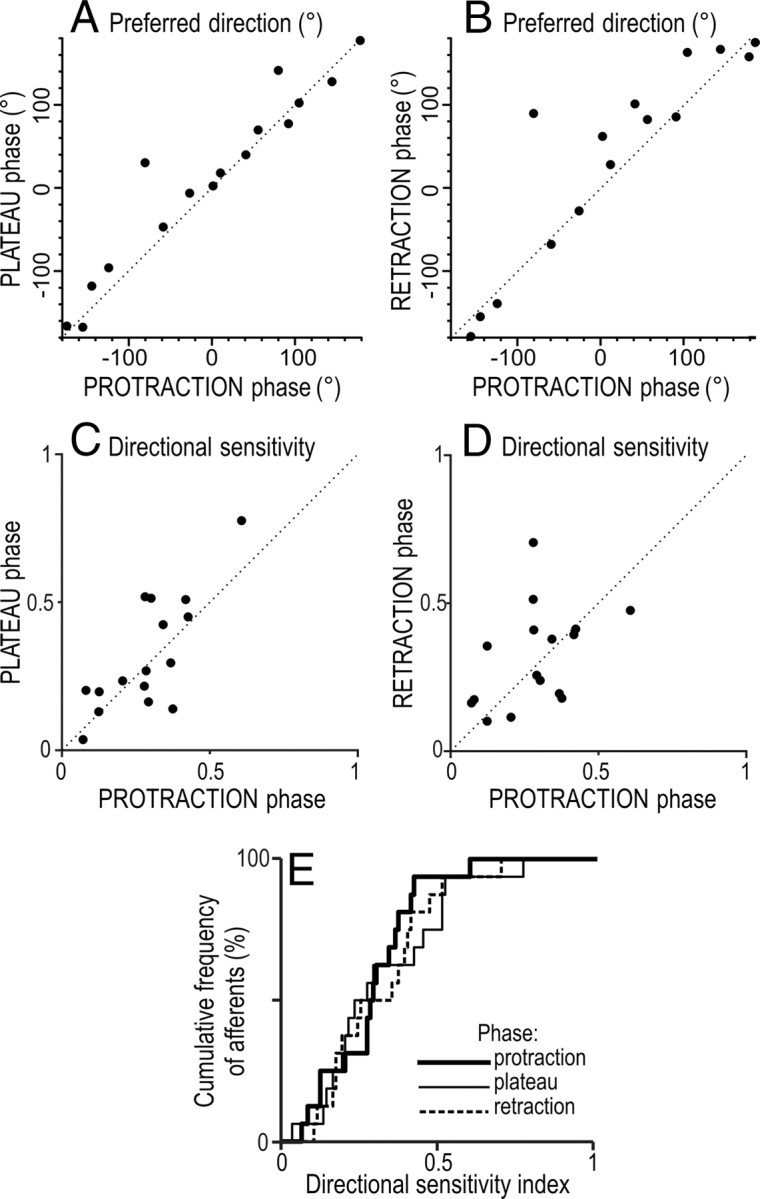
There are clusters of slowly adapting (SA) mechanoreceptors in the skin folds bordering the nail. These "SA-IInail" afferents, which constitute nearly one fifth of the tactile afferents innervating the fingertip, possess the general discharge characteristics of slowly adapting type II (SA-II) tactile afferents located elsewhere in the glabrous skin of the human hand. Little is known about the signals in the SA-IInail afferents when the fingertips interact with objects. Here we show that SA-IInail afferents reliably respond to fingertip forces comparable to those arising in everyday manipulations. Using a flat stimulus surface, we applied forces to the finger pad while recording impulse activity in 17 SA-IInail afferents. Ramp-and-hold forces (amplitude 4 N, rate 10 N/s) were applied normal to the skin, and at 10, 20, or 30 degrees from the normal in eight radial directions with reference to the primary site of contact (25 force directions in total). All afferents responded to the force stimuli, and the responsiveness of all but one afferents was broadly tuned to a preferred direction of force. The preferred directions among afferents were distributed all around the angular space, suggesting that the population of SA-IInail afferents could encode force direction. We conclude that signals in the population of SA-IInail afferents terminating in the nail walls contain vectorial information about fingertip forces. The particular tactile features of contacted surfaces would less influence force-related signals in SA-IInail afferents than force-related signals present in afferents terminating in the volar skin areas that directly contact objects.


Figures

Figure 1.
Figure 1.
Experimental protocol and afferent sample. A, Distribution of loci of maximum sensitivity to pointed skin indentation for all SA-IInail afferents projected on the dorsal aspect of the fingertip. The black dots indicate the 17 afferents for which the recordings were stable enough that sufficient data were collected for statistical analyses. B, Outline of a fingertip showing the primary site of stimulation (filled circle). Note the polar coordinate conventions; U (0°), P (90°), R (180°), and D (270°). Gray zone on the finger drawings indicate an estimate of the area of contact at 4 N plateau normal force (Birznieks et al., 2001). C, The flat stimulus surface was parallel to the flat portion of skin. Force stimuli were delivered normal to the skin over the center of the finger pad, and at 10, 20, or 30° to the normal (vertical angle) in eight radial directions (total number of stimuli = 25) as exemplified by the arrows along distal-proximal axes; the normal force was always 4 N.
Figure 2.
Figure 2.
Overall responsiveness of afferents with directional stimuli. A, Mean number of impulses elicited during the force protraction phase (0.4 s duration) function of force angle relative to normal (vertical angle). For vertical angles different from zero (normal-force-only) the data were averaged across all 8 radial force directions. Each gray curve refers to a single afferent and the black curve to the grand mean across all afferents; vertical lines represent ±1 SEM. B, Difference in mean responses elicited at 30° and 0° vertical angles as a function of overall responsiveness (mean response averaged across all 25 stimulation directions). Each symbol represents a single afferent and the line show the linear regression.
Figure 3.
Figure 3.
Force stimuli applied to the standard test site at the center of the fingerpad while recording action potentials in a single SA-IInail afferent. Stimuli were delivered with normal force only (far left) and with tangential force components in eight directions (arrows in the circular coordinate system in the top row; D, R, P, and U refer to distal, radial, proximal, and ulnar direction). Overlaid black and gray lines represent force and position signals, respectively. Position signals indicated by solid lines show displacement of the stimulation surface when in contact with the skin; broken lines indicate the position of the surface along the axis normal to the skin when the surface moves in the air between force stimuli. Note that the position signal in tangential directions is not shown when the stimulation surface is not in contact with the skin. The gray shaded areas indicate the periods when the stimulation surface made contact with the fingertip skin. The normal force component was 4 N, and when tangential force component was present, the force vector angle relative to the normal was 30°. Data correspond to a single stimulation sequence, except the nerve impulse ensembles, which show the current stimulation sequence (indicated by an asterisk) as well as data from five repetitions of the same sequence. This unit was maximally responsive to forces with a tangential component applied between the proximal and proximal-ulnar directions and weakest when applied in distal-radial directions. The arrow originating from the primary site of stimulation shows its preferred direction. Insets on the right show the most sensitive spot of the afferent to point indentations of the skin, projected onto the fingertip outline from the volar and dorsal aspects. The gray line on the volar aspect indicates the outline of the nail as if seen through the fingertip.
Figure 4.
Figure 4.
Polar plots of the directionality of the responses during the protraction phase for each the 16 directional sensitive SA-IInail afferents when tested with tangential forces delivered 30° from normal. A, The polar plot consists of eight solid straight lines joining the response magnitudes in the eight tangential force directions (45° apart) measured as the number of impulses evoked during the protraction phase. The origin of the coordinate system is at the primary site of stimulation. Arrows show the preferred directions of the 16 afferents. The length of the vector represents the directional sensitivity index. The vertical bar next to each polar plot shows the afferent response during the normal-force-only stimulation. The two upper rows show afferents terminating on the ulnar side of the nail, and the two bottom rows represent afferents terminating on the radial side (compare Fig. 1A). The asterisk refers to the afferent featured in Figure 4. B, Preferred direction vectors originating from the primary site of contact are shown divided into two groups, according to whether the afferent terminated on the ulnar or radial side of the nail (black dots projected on the contours of the fingertip). Finger and nail projections are viewed from the volar aspect of the finger.
Figure 5.
Figure 5.
Comparison of estimates of preferred directions to tangential force component applied at different vertical angles for 16 SA-IInail afferents. A, B, Scatter plots showing the relationship between the preferred directions estimated with stimulation forces applied at 30° versus 20° vertical angles (raa = 0.96, p < 0.001), and at 30° versus 10° vertical angles (raa = 0.48, p < 0.01), respectively. Two outliers are coded by open circles in B. The dotted line is a unity line showing equivalent preferred direction on the ordinate and abscissa. Polar coordinate as in Figures 1B and 4A.
Figure 6.
Figure 6.
Directional sensitivity index at three different vertical angles of force stimulation (10, 20, and 30°) for 16 SA-IInail afferents. A, Cumulative frequency distribution of the directional sensitivity indices. B, Scatter plots show the relationship between indices estimated with stimulation forces applied at 30° versus 20° vertical angles (rs = 0.77, p < 0.001; open circles), and at 30° versus 10° vertical angles (rs = 0.67, p < 0.005; asterisks). Each symbol represents a single afferent and the line shows the linear regression; the thin dotted line is the line of unity, showing equivalent directional sensitivity on the ordinate and abscissa.
Figure 7.
Figure 7.
Tuning curves illustrating the afferent responses as a function of the direction of the tangential force component relative to the direction of the strongest response (0°) provided by stimuli delivered at angle 30° to the normal (vertical angle). A, B, Data from two single afferents and for all three vertical angles of force stimulation (10, 20, 30°). The vertical position of the dashed lines represents for each vertical angle the mean response computed across eight tangential directions. The broadness of tuning was defined as the width of the tuning curve (°) at this line and corresponds to the black segments of the curve, for which the response values exceeded the mean response. C, D, Tuning curves as in A and B superimposed for all afferents, where the top, middle, and bottom panels refer to data obtained with a vertical angle of 30, 20, and 10°, respectively. Graphs in C show data from the eight afferents with the lowest overall responsiveness and in D for the remaining eight afferents with higher overall responsiveness. The gray curves and symbols refer to single afferents and the black curve to the mean across afferents, with vertical lines representing ±1 SEM.
Figure 8.
Figure 8.
Broadness of tuning for 16 SA-IInail afferents to the direction of tangential force at three different vertical angles of force stimulation (10, 20, and 30°). A, Cumulative frequency distribution of the broadness of tuning. B, Scatter plot displaying the relationship between the broadness of tuning at 30° vertical angle versus broadness of tuning with forces applied at 20° vertical angle (rs = 0.82; p < 0.001; open circles) and at 10° vertical angle (rs = 0.51; p < 0.05; asterisks). The thin dotted line is the line of unity, showing equivalent broadness on the ordinate and abscissa. C, Broadness of tuning as a function of the afferents' overall responsiveness. B, C, Each symbol represents a single afferent and the related line shows the linear regression.
Figure 9.
Figure 9.
Tuning curves illustrating the afferent's response as a function of direction of the force relative to the normal (0°) along the axis of the “least–most” preferred direction represented by −30 to 30°. A, B, Number of impulses elicited as a function of vertical force angle in relative to normal (vertical angle) for the eight afferents with the lowest overall responsiveness (A) and for the remaining eight afferents with higher overall responsiveness (B). The gray curves refer to single afferents and the black curve to means across afferents with vertical lines representing ± 1 SEM. C, Correlation between afferents' overall responsiveness and the modulation of their responses by direction of vertical force along the axis of the “least–most” preferred direction (rs = −0.63; p < 0.01). The modulation was computed as the ratio between the SD of the responses to stimuli with forces in all seven vertical angles and the mean response to stimuli in all seven angles (cf. coefficient of variation). Each symbol represents a single afferent and the line show the linear regression.
Figure 10.
Figure 10.
Comparison of directionality of 16 SA-IInail afferents during different phases of the stimulus applied at 30° angle relative to normal. A, B, Relationship between preferred direction during the protraction phase and that during the plateau phase (raa = 0.73, p <0.01) and during the retraction phase (raa = 0.45, p <0.05). C, D, Relationship between the directional sensitivity indices during protraction versus the plateau phase (rs = 0.64, p <0.01) and versus the retraction phases (rs = 0.48, p = 0.06). E, Cumulative distribution of directional sensitivity indices during different phases of stimulation. A–D, The dotted line is a unity line showing equivalent preferred direction on the ordinate and abscissa. Polar coordinates as in Figures 1B and 4A.

Similar articles

Cited by

References

    1. Ashbell TS, Kleinert HE, Putcha SM, Kutz JE. The deformed finger nail, a frequent result of failure to repair nail bed injuries. J Trauma. 1967;7:177–190. - PubMed
    1. Birznieks I, Jenmalm P, Goodwin AW, Johansson RS. Encoding of direction of fingertip forces by human tactile afferents. J Neurosci. 2001;21:8222–8237. - PMC - PubMed
    1. Bisley JW, Goodwin AW, Wheat HE. Slowly adapting type I afferents from the sides and end of the finger respond to stimuli on the centre of the fingerpad. J Neurophysiol. 2000;84:57–64. - PubMed
    1. Burgess PR, Perl ER. Cutaneous mechanoreceptors and nociceptors. In: Iggo A, editor. Handbook of sensory physiology. Berlin: Springer; 1973. pp. 30–78.
    1. Calford MB, Tweedale R. Immediate and chronic changes in responses of somatosensory cortex in adult flying-fox after digit amputation. Nature. 1988;332:446–448. - PubMed

Publication types

LinkOut - more resources