. 2009 Oct;102(4):2142-60.
doi: 10.1152/jn.00522.2009. Epub 2009 Jul 22.

Stable encoding of task structure coexists with flexible coding of task events in sensorimotor striatum

Affiliations

Stable encoding of task structure coexists with flexible coding of task events in sensorimotor striatum

Yasuo Kubota et al. J Neurophysiol. 2009 Oct.

Abstract

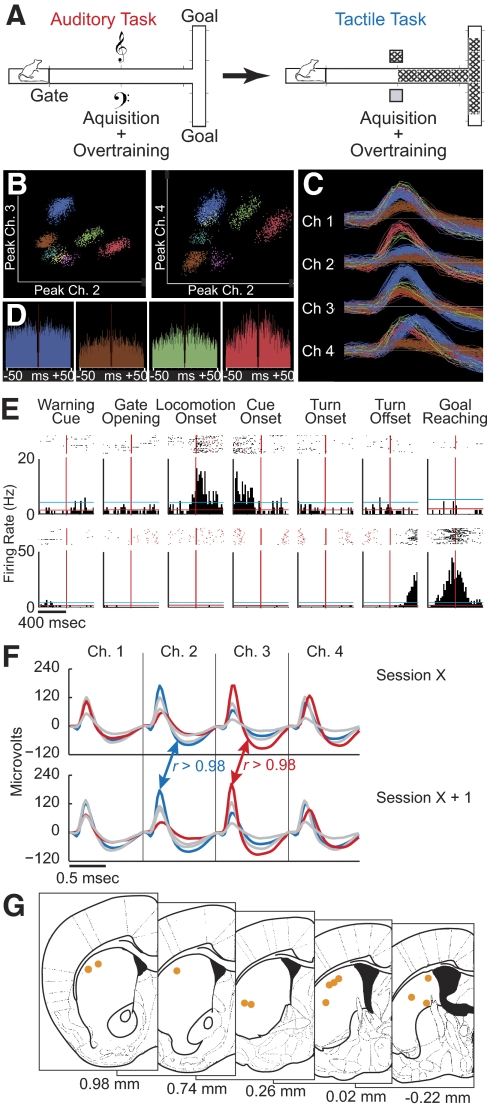
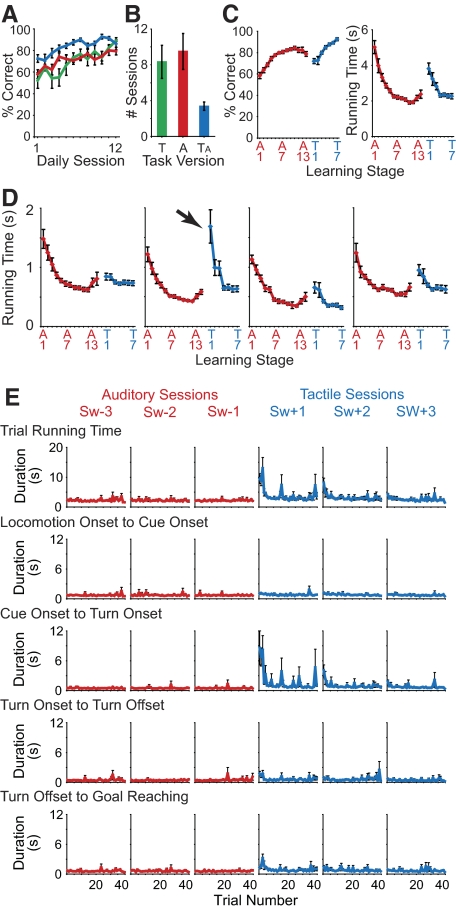
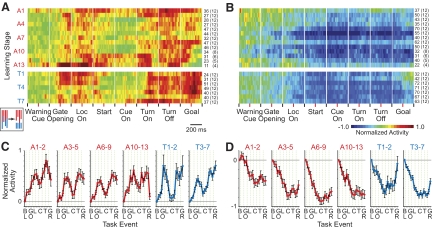
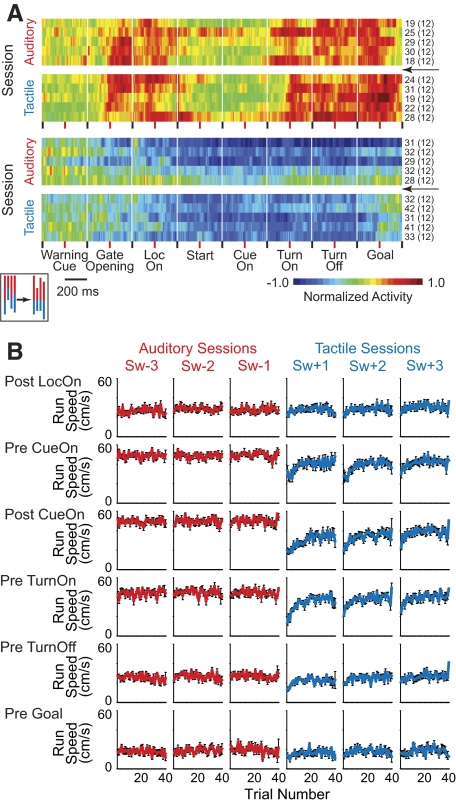
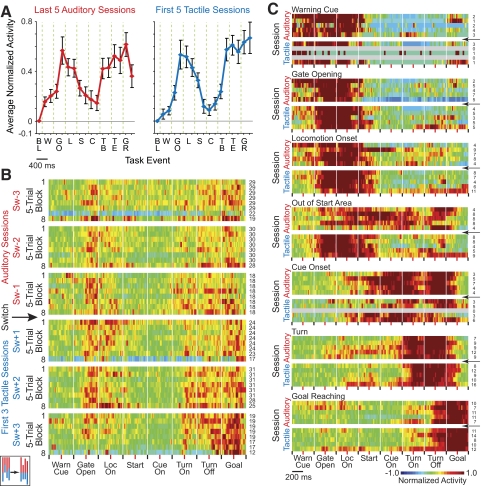
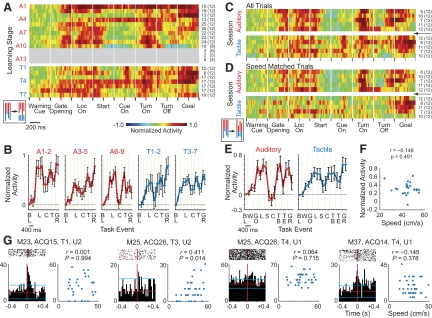
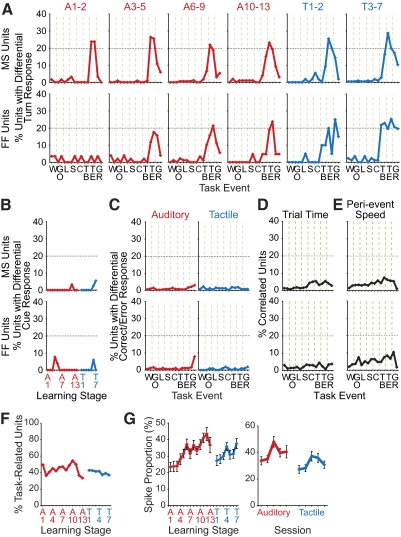
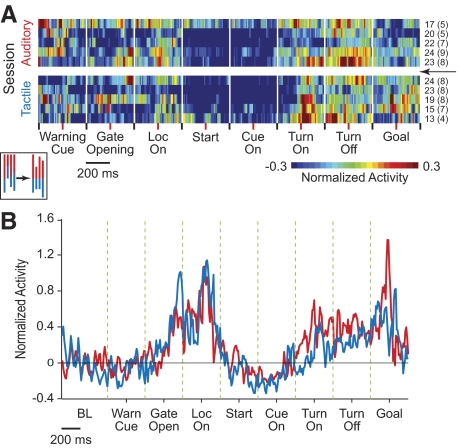
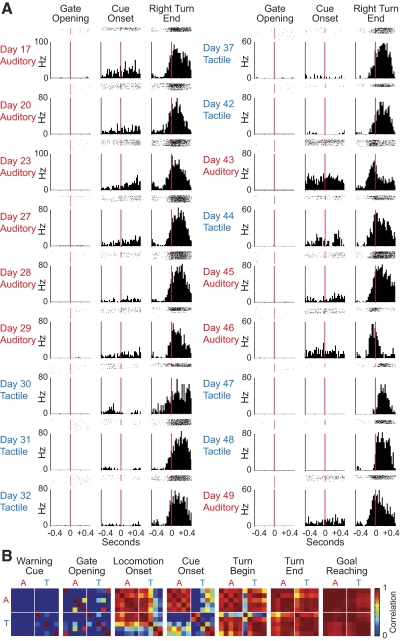
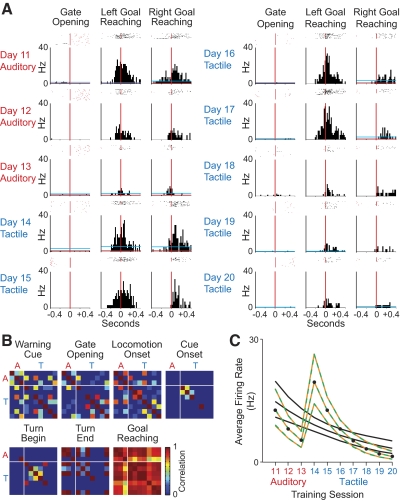
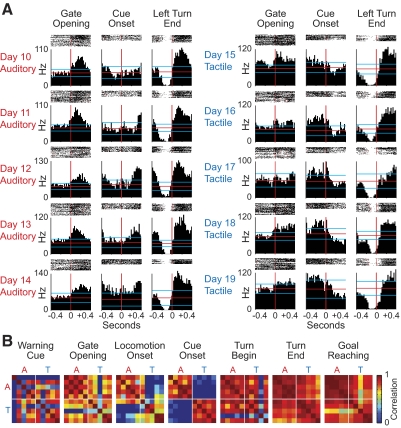
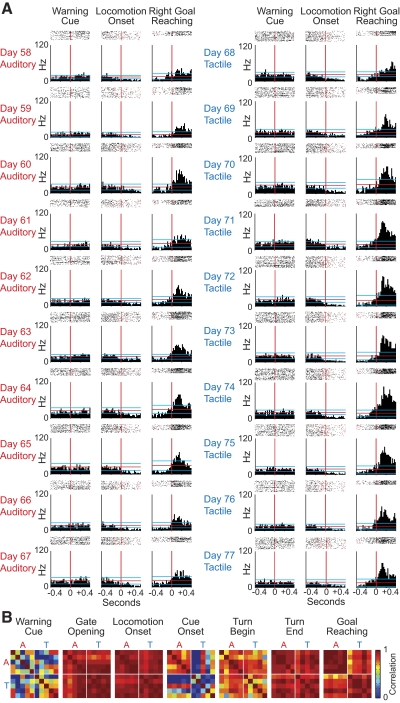
The sensorimotor striatum, as part of the brain's habit circuitry, has been suggested to store fixed action values as a result of stimulus-response learning and has been contrasted with a more flexible system that conditionally assigns values to behaviors. The stability of neural activity in the sensorimotor striatum is thought to underlie not only normal habits but also addiction and clinical syndromes characterized by behavioral fixity. By recording in the sensorimotor striatum of mice, we asked whether neuronal activity acquired during procedural learning would be stable even if the sensory stimuli triggering the habitual behavior were altered. Contrary to expectation, both fixed and flexible activity patterns appeared. One, representing the global structure of the acquired behavior, was stable across changes in task cuing. The second, a fine-grain representation of task events, adjusted rapidly. Such dual forms of representation may be critical to allow motor and cognitive flexibility despite habitual performance.


Figures

Fig. 1.
Fig. 1.
Experimental methods. A: behavioral task. BD: sorting of recorded units. Clusters forming on spike dot plots defined putative single units (B). These clusters were then verified with shapes of spike waveforms (C) and a pause in spiking detected in autocorrelograms (D) and in interspike interval plots. E: task-related activity of putative medium-spiny projection neurons with responses at locomotion onset (top) and with responses at goal reaching (bottom). Each peri-event time histogram (PETH) shows session average firing rates during ±400-ms intervals around task events. Red and blue horizontal lines indicate, respectively, mean baseline firing rates and levels 2 SD above and below the baseline mean. Raster plots show occurrence of spikes (black) and surrounding events (red) during trials of the training session. F: methods for matching average spike waveforms across sessions to track single units over multiple sessions. The pairs of units across consecutive daily sessions that had correlation values of >0.98 were judged putatively to be the same unit. See methods. G: recording sites in the dorsolateral caudoputamen in the 12 mice with tetrode recording.
Fig. 2.
Fig. 2.
Behavioral performance. A: average percentage of correct responses during the 1st 12 training sessions of mice trained only on the tactile version of the T-maze task (green) and mice successively trained on the auditory version (red) and then on the tactile version (blue). Error bars indicate SEs of the mean. B: the number of sessions required to reach the acquisition criterion. T, tactile training only. A, initial auditory training. TA, tactile training following auditory training. C: average percentages of correct responses (left) and average maze-running times (right) during successive training on the auditory (red) and tactile (blue) task versions. Learning stages are defined in methods. D: average running times for inter-event intervals, from left to right, locomotion onset to cue onset, cue onset to turn onset (arrow marking sharp increase at cue switch), turn onset to turn offset, and turn offset to goal reaching. E: average trial-by-trial running times (top) and 4 successive inter-event durations (rows 2–5) during the last 3 auditory and the first 3 tactile sessions.
Fig. 3.
Fig. 3.
Activity of medium-spiny neurons of the striatum during successive training on the auditory and tactile task versions. A and B: average population activity of task-related (A) and “nontask-responsive” (B) units averaged for each learning stage (auditory: A1–13; tactile: T1–7), plotted using the pseudocolor scale shown at bottom right. For each unit, spike counts in each 20-ms bin were normalized according to FRN = (XMB)/SDB+T (FRN, normalized firing rate; X, bin spike count; MB, baseline mean firing rate; SDB+T, baseline and trial time SD). FRN values were then averaged across units recorded in each stage. Plots were made by abutting successive ±200-ms peri-event windows (as labeled, separated by white vertical lines) according to their order of occurrence within a trial. Bottom left inset: alignment of training sessions. Numbers of units and numbers of mice (in parentheses) available for each learning stage are listed at right. C and D: average normalized activity of task-related (C) and nontask-responsive (D) units calculated for 500-ms pretrial baseline period (BL) and for 200-ms intervals before and after the warning cue, gate opening (GO), locomotion onset (L), out of the start area, cue onset (C), turn (T) beginning and end, and goal reaching (GR). Data are averaged across learning stages for 6 phases of training. ANOVA performed on these data indicated that activity of task-related units in the windows around locomotion onset and from beginning of turn to goal reaching was higher than that during baseline throughout training (P < 0.05). Activity before and after cue onset declined during acquisition, and by early overtraining (stages A6–9), activity was significantly lower in peri-cue periods than in peri-turn offset and pregoal periods. These patterns continued to be significant during acquisition and overtraining on the tactile task (stages T1–2 and T3–7; P < 0.05). Activity of nontask-responsive units during trial runs significantly declined from stages A1–2 to A6–9 (P < 0.05). Error bars represent SE of the mean.
Fig. 4.
Fig. 4.
Ensemble activity of task-related MS neurons and running speed around cue switch. A: average normalized ensemble activity, calculated as for Fig. 3, of task-related MS units during 10 sessions around cue switch (←). Session alignment is shown as in Fig. 3A. B: trial-by-trial running speed in 200-ms pre- and post-event intervals (as labeled) during 6 sessions around cue switch.
Fig. 5.
Fig. 5.
Stable activity of MS neurons across cue switch. A: normalized activity of task-related MS units averaged over the last 5 auditory sessions (left) and the first 5 tactile sessions (right) for the pretrial baseline period and for 200-ms intervals before and after each task event. B: pseudo-color plots of normalized ensemble activity during 6 sessions around cue switch (←). For each session, average activity during consecutive 5-trial blocks is plotted in each row. Session alignment is shown as in Fig. 3A. C: average ensemble activity of units with responses to individual task events, including those showing responses to >1 event. Gray entries, days with no accepted units.
Fig. 6.
Fig. 6.
Ensemble activity of fast-firing interneurons of the striatum. A: average normalized activity of task-related fast-firing interneuron (FF) units during successive training on the auditory and tactile task versions, calculated as for Fig. 3. Gray entries, stages with fewer than 6 recorded units, excluded from analysis. B: average normalized activity of task-related FF units over 200-ms pre- and post-event windows during, from left to right, stages A1–2, A3–5, A6–9, T1–2, and T3–7. These plots show that firing rates around locomotion onset and goal reaching were higher only than the rates before trial runs during auditory task acquisition (P < 0.05). Their activity during mid-run then decreased and became significantly lower than that in peri-locomotion onset (A6–9), postturn onset (A6–9), and postgoal (A3–5) periods. Activity during periods from after turn to goal reaching did not differ significantly from pretrial activity in stages A6–9. The beginning-and-end ensemble activity pattern was weaker during tactile acquisition (T1–2, P = 0.02) but returned to the preswitch level in overtraining (T3–7, P < 0.001). C and D: activity of task-related FF units during 10 sessions around cue switch (←) with all trials (C) and after discarding trials in which cue-turn durations were greater than mean +2 SD of last auditory session (D). Symbols as in Fig. 4. E: firing rates in 200-ms pre- and postevent intervals averaged over the last 5 auditory sessions (left) and over the 1st 5 tactile sessions (right). The postcue activity was greater in the first 5 tactile sessions than in the last 5 auditory sessions (P = 0.027). F: scatter plot illustrating a lack of correlation between postcue running speed and average activity calculated for 5-trial blocks in the first 3 tactile sessions. G: peri-cue response histograms (left) and scatter plots of trial-by-trial running speed and firing rates during 200-ms post-cue window (right) for 4 FF task-related units that exhibited cue-related discharges on the 1st tactile session. Correlations coefficient (r) and P value (P) are shown for each unit.
Fig. 7.
Fig. 7.
Task-related activity profiles of MS and FF units. A: proportions of MS (top) and FF (bottom) units that fired differentially for trials with right and left turns during successive 200-ms pre-/post-event periods across 6 phases of training. Note increased values for FF units. B: proportions of MS (top) and FF (bottom) units with differential responses to conditional cues during postcue period across learning stages. C: proportions of MS (top) and FF (bottom) units with differential responses in correct and incorrect trials averaged over auditory (red) and tactile (blue) sessions. D and E: proportions of task-related MS (top) and FF (bottom) units with significant correlations (P < 0.01) between firing rates during 200-ms pre- and post-event windows and trial running times (D) and between firing rates and running speed within each peri-event window (E). F: percentages of MS units with responses to any task event relative to all accepted projection neurons. G: changes in proportion of spikes that occurred within detected peaks of phasic neuronal responses during auditory and tactile training (left) and during 10 sessions around switch (right).
Fig. 8.
Fig. 8.
Stability of putative single MS neuron ensembles across the cue switch. A: average normalized activity of 24 MS units, including those with and without task-related responses, tracked over a minimum of 6 sessions across the switch in task version, plotted as described in Figs. 3A and 4A. B: line plots illustrating average activity of 14 task-related MS units in the last auditory session (red) and in the first tactile session (blue). These units were identified as PSNs over these 2 sessions. Note that the 2 lines virtually overlap.
Fig. 9.
Fig. 9.
Differential responses to auditory and tactile cues of putative single MS neuron tracked across the switch in task version. A: session average PETHs, as described in Fig. 1E, of spike activity, aligned at gate opening, 8-kHz tone/smooth cue, and right turn-end during sequential training on the auditory (days 17–29) and tactile (days 30–42) task versions, followed by alternation between the task versions (days 43–49). Pre- and post-cue activity was significantly different between auditory and tactile task versions (P < 0.0001), but activity at right turn was not (P = 0.13). B: correlation matrix of peri-event histograms (±400-ms windows, 20-ms bins) among 10 daily sessions around the cue switch, calculated separately for each task event, as labeled. Scale is shown at right.
Fig. 10.
Fig. 10.
Activity of putative single MS neuron with rebound of goal-related activity at cue switch. A: PETHs, constructed as in Fig. 1E, aligned at gate opening, left goal reaching, and right goal reaching during the last 3 auditory sessions and first 7 tactile sessions. B: correlation matrix of event-related discharges during these 10 sessions as described in Fig. 9B. C: Poisson generalized linear models without a change point (black), with a change-point at cue switch (dashed green), and with a change point at undefined time (orange), fitted to average firing rates during 200-ms intervals after right goal reaching (solid circles). Note that green and orange lines almost completely overlap.
Fig. 11.
Fig. 11.
Putative single FF neuron with changes in precue activity at cue switch. A: PETHs aligned at gate opening, 1-kHz tone/smooth cue onset and left turn end during 10 consecutive sessions around cue switch. B: correlation matrix of task-related responses as described in Fig. 9B.
Fig. 12.
Fig. 12.
Putative single neuron with stable activity across cue switch. A: PETHs aligned at warning cue, locomotion onset, and right goal reaching. B: correlation matrix of event-related responses during 10 sessions around cue switch as described in Fig. 9B.

Similar articles

Cited by

References

    1. Aldridge JW, Berridge KC, Rosen AR. Basal ganglia neural mechanisms of natural movement sequences. Can J Physiol Pharmacol 82: 732–739, 2004 - PubMed
    1. Alloway KD, Lou L, Nwabueze-Ogbo F, Chakrabarti S. Topography of cortical projections to the dorsolateral neostriatum in rats: multiple overlapping sensorimotor pathways. J Comp Neurol 499: 33–48, 2006 - PubMed
    1. Aosaki T, Tsubokawa H, Ishida A, Watanabe K, Graybiel AM, Kimura M. Responses of tonically active neurons in the primate's striatum undergo systematic changes during behavioral sensorimotor conditioning. J Neurosci 14: 3969–3984, 1994 - PMC - PubMed
    1. Atallah HE, Lopez-Paniagua D, Rudy JW, O'Reilly RC. Separate neural substrates for skill learning and performance in the ventral and dorsal striatum. Nat Neurosci 10: 126–131, 2007 - PubMed
    1. Balleine BW, Delgado MR, Hikosaka O. The role of the dorsal striatum in reward and decision-making. J Neurosci 27: 8161–8165, 2007 - PMC - PubMed

Publication types

LinkOut - more resources