Hemispheric lateralization of pain processing by amygdala neurons
- PMID: 19625541
- PMCID: PMC2776996
- DOI: 10.1152/jn.00166.2009
Hemispheric lateralization of pain processing by amygdala neurons
Abstract
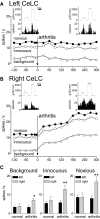
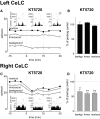
Recent biochemical and behavioral data suggest right-hemispheric lateralization of amygdala functions in pain. Our previous electrophysiological studies showed pain-related neuroplasticity in the latero-capsular division of the central nucleus of the amygdala (CeLC) in the right brain hemisphere. Here we determined differences in the processing of pain-related signals in right versus left CeLC neurons. Individual CeLC neurons were recorded extracellularly before and after induction of an arthritis pain state in anesthetized rats. Brief innocuous and noxious test stimuli were applied to peripheral tissues ipsi- and contralateral to the recording site. A monoarthritis was induced in the ipsi- or contralateral knee by intraarticular injections of kaolin and carrageenan. Under normal conditions, CeLC neurons in the left amygdala had smaller receptive fields than those in the right, but the magnitude of background and evoked activity was not significantly different. After arthritis induction, neurons in the right, but not left, CeLC developed increased background activity and evoked responses, irrespective of the location of the arthritis (ipsi- or contralateral to the recording site). A protein kinase A (PKA) inhibitor decreased the activity of right CeLC neurons after arthritis induction but had no effect in the left amygdala. Forskolin, however, increased the activity of left and right CeLC neurons under normal conditions. The results show for the first time laterality of pain-related electrophysiological activity changes in individual amygdala neurons. Whereas both left and right amygdala neurons receive nociceptive inputs and can become sensitized in principle, a yet unknown mechanism prevents PKA activation and pain-related changes in the left amygdala.
Figures


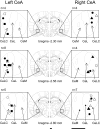
 , high-threshold receptive fields, stimulation of which activated the neuron weakly. i.l., ipsilateral; c.l., contralateral to recording site. A: under normal conditions, receptive fields of right CeLC neurons (n = 15) were symmetrical in the deep tissue of both hindlimbs and the tail (n = 7, left) or covered the whole body (n = 8, right). B: receptive fields of left CeLC neurons (n = 17) were either confined to the contralateral hindlimb (n = 9) or included an additional high-threshold receptive field in the ipsilateral hindlimb (n = 8). C: semi-quantitative analysis of the receptive field size in neurons that were recorded continuously before and after arthritis induction. The body map was divided into 21 areas (A and B, - - -). The total number of areas that contained part of the receptive field was calculated for each neuron and averaged for left (n = 11) and right (n = 9) CeLC neurons (see Data analysis). Only neurons that were recorded before and after arthritis induction are included in the analysis. In the graph, each box extends from the 25th to the 75th percentile, with a line at the median (50th percentile). The whiskers extend above and below the box to show the highest and lowest values. ***, P < 0.0005 (receptive field size of right compared with left CeLC neurons; Mann-Whitney U test), #, P < 0.025 (receptive field size after arthritis compared with normal; Wilcoxon signed-rank test), alpha level adjusted for multiple comparisons.


References
-
- Adamec R, Blundell J, Burton P. Role of NMDA receptors in the lateralized potentiation of amygdala afferent and efferent neural transmission produced by predator stress. Physiol Behav 86: 75–91, 2005a - PubMed
-
- Adamec RE, Blundell J, Burton P. Neural circuit changes mediating lasting brain and behavioral response to predator stress. Neurosci Biobehav Rev 29: 1225–1241, 2005b - PubMed
-
- Adolphs R. Neural systems for recognizing emotion. Curr Opin Neurobiol 12: 169–177, 2002 - PubMed
-
- Angrilli A, Mauri A, Palomba D, Flor H, Birbaumer N, Sartori G, di PF. Startle reflex and emotion modulation impairment after a right amygdala lesion. Brain 119: 1991–2000, 1996 - PubMed
-
- Atchley RA, Ilardi SS, Enloe A. Hemispheric asymmetry in the processing of emotional content in word meanings: the effect of current and past depression. Brain Lang 84: 105–119, 2003 - PubMed
Publication types
MeSH terms
Substances
Grants and funding
LinkOut - more resources
Full Text Sources
Other Literature Sources
Medical

