. 2009 Oct;102(4):2039-54.
doi: 10.1152/jn.00075.2009. Epub 2009 Jul 22.

Encoding and decoding of learned smooth-pursuit eye movements in the floccular complex of the monkey cerebellum

Affiliations

Encoding and decoding of learned smooth-pursuit eye movements in the floccular complex of the monkey cerebellum

Javier F Medina et al. J Neurophysiol. 2009 Oct.

Abstract

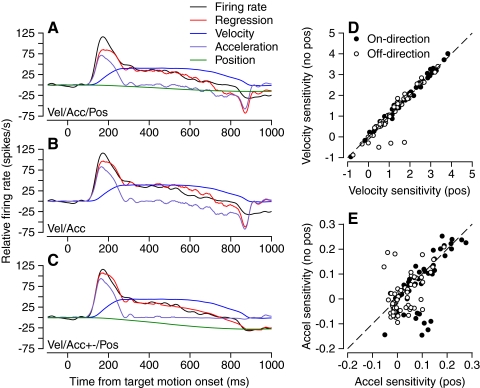
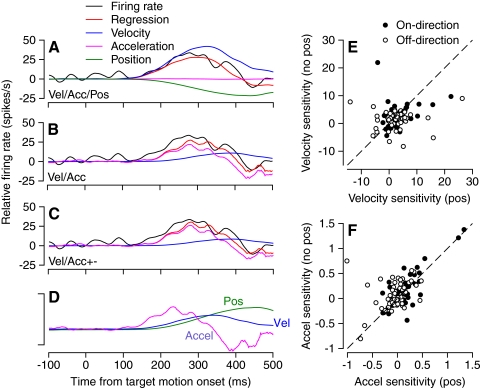
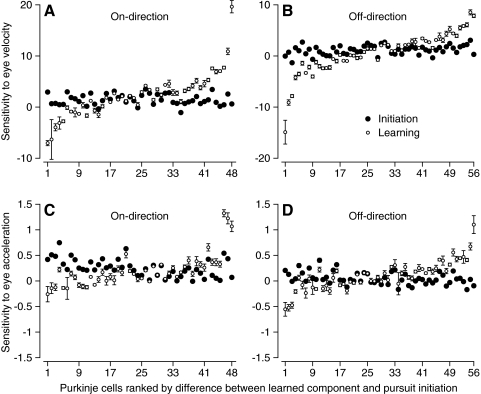
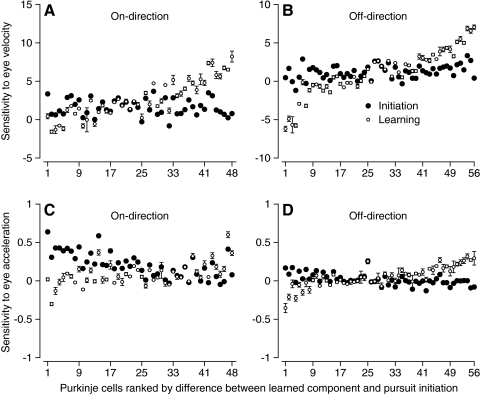
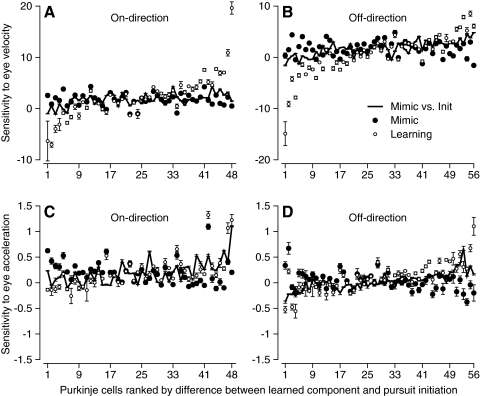
We recorded the simple-spike (SS) firing of Purkinje cells (PCs) in the floccular complex both during normal pursuit caused by step-ramp target motions and after learning induced by a consistently timed change in the direction of target motion. The encoding of eye movement by the SS firing rate of individual PCs was described by a linear regression model, in which the firing rate is a sum of weighted components related to eye acceleration, velocity, and position. Although the model fit the data well for individual conditions, the regression coefficients for the learned component of firing often differed substantially from those for normal pursuit of step-ramp target motion. We suggest that the different encoding of learned versus normal pursuit responses in individual PCs reflects different amounts of learning in their inputs. The decoded output from the floccular complex, estimated by averaging responses across the population of PCs, also was fitted by the regression model. Regression coefficients were equal for the two conditions for on-direction pursuit, but differed for off-direction target motion. We conclude that the average output from the population of floccular PCs provides some, but not all, of the neural signals that drive the learned component of pursuit and that plasticity outside of the flocculus makes an important contribution.


Figures

Fig. 1.
Fig. 1.
Four important behavioral paradigms demonstrated by data from a representative Purkinje cell (PC). A: the normal initiation and steady state of pursuit for target motion in the on-direction of the PC under study. B: probe trials along the axis orthogonal to the preferred axis, used to assess the amount of learning induced after the direction of target motion changed consistently in a series of prior trials. C: the initiation and steady state of pursuit for target motion designed to cause eye movements that mimicked the learned component of pursuit in a given experiment. D: learning trials in which the direction of target motion changed 250 ms after the onset of target motion along the probe direction, orthogonal to the preferred axis of the PC under study. Each column is headed by a polar plot where the arrow shows the trajectory of target position. From top to bottom, the graphs show superimposed horizontal eye and target positions, superimposed vertical eye and target positions, horizontal eye velocity, vertical eye velocity, and firing rate. In the top 2 graphs, dashed and solid curves show target and eye positions. Data traces are averages across ≥10 responses to the same target motion. In B, the gray and black traces show data obtained before or after learning.
Fig. 2.
Fig. 2.
Linear regression analysis of the initiation of pursuit for a representative PC. In AC, the black, red, purple, blue, and green traces show, respectively, the actual firing rate, the prediction of the linear regression model, the eye acceleration component [aË(t) or apË(t) + anËn(t)], the eye velocity component [bË(t)], and the eye position component [cE(t)]. Regression models are Eq. 2 in A, Eq. 1 in B, and Eq. 4 in C. D: scatterplot showing near identity of eye velocity regression coefficients based on regression with Eq. 3 on the y-axis vs. Eq. 4 on the x-axis. E: scatterplot showing similarity of positive eye acceleration regression coefficients based on regression with Eq. 3 on the y-axis vs. Eq. 4 on the x-axis. In D and E, filled and open symbols show data for on-direction and off-direction of pursuit.
Fig. 3.
Fig. 3.
Linear regression analysis of learned component of pursuit for a representative PC. Data used for regression analysis were obtained by subtracting averages for prelearning probe trials from averages for postlearning probe trials. In AC, the black, red, purple, blue, and green traces show, respectively, the actual firing rate, the prediction of the linear regression model, the eye acceleration component [aË(t) or apË(t) + anËn(t)], the eye velocity component [bË(t)], and the eye position component [cE(t)]. Regression models are Eq. 2 in A, Eq. 1 in B, and Eq. 3 in C. In D, the 3 traces show averages of eye acceleration, velocity, and position. Calibration bar indicates 200°/s2, 18.7°/s, and 2.8° for the 3 traces. The traces are aligned with the onset of target motion and the instructive change in target direction occurred at 250 ms. E: scatterplot showing variation of eye velocity regression coefficients based on regression with Eq. 3 on the y-axis vs. Eq. 4 on the x-axis. F: scatterplot showing variation of positive eye acceleration regression coefficients based on regression with Eq. 3 on the y-axis vs. Eq. 4 on the x-axis. In E and F, filled and open symbols show data for on-direction and off-direction of pursuit.
Fig. 4.
Fig. 4.
Analysis of the fraction of variance of average firing rate accounted for by different regression models. Each graph shows a collection of cumulative distributions of variance accounted for (VAF) when different regression models were applied to the same data. A: on-direction pursuit initiation. B: off-direction pursuit initiation. C: on-direction learned component of pursuit. D: off-direction learned component of pursuit. Key is: Eq. 1, acc/vel; Eq. 2, acc/vel/pos; Eq. 3, acc+−/vel; Eq. 4, acc+−/vel/pos.
Fig. 5.
Fig. 5.
Comparison of learned component of responses and initiation of pursuit for a PC with a large difference in eye velocity regression coefficients. Black and dashed traces show responses to step-ramp target motion and the learned component of pursuit. Arrows show the values of each curve during the appropriate measurement interval. Note that the data for the initiation of pursuit have a large transient response during the rapid eye acceleration, but a lower steady firing related to steady eye velocity. The latter is responsible for the value of the eye velocity regression coefficient for the responses to step-ramp target motion.
Fig. 6.
Fig. 6.
Statistical analysis of the difference between the eye velocity and acceleration sensitivities for the learned component of simple-spike (SS) firing vs. the response during the initiation of pursuit. A: eye velocity sensitivity in the on-direction. B: eye velocity sensitivity in the off-direction. C: eye acceleration sensitivity in the on-direction. D: eye acceleration sensitivity in the off-direction. Filled and open symbols summarize the regression analysis for the responses to step-ramp target motion along the preferred axis, and for the learned component of SS firing. Error bars indicate confidence intervals for the regression coefficients. Regression was performed using the firing rate from individual trials, and the averages of eye movement across trials.
Fig. 7.
Fig. 7.
Statistical analysis of the difference between the eye velocity and acceleration sensitivities for the learned component of SS firing vs. the response during the initiation of pursuit. A: eye velocity sensitivity in the on-direction. B: eye velocity sensitivity in the off-direction. C: eye acceleration sensitivity in the on-direction. D: eye acceleration sensitivity in the off-direction. Filled and open symbols summarize the regression analysis for the responses to step-ramp target motion along the preferred axis, and for the learned component of SS firing. Error bars indicate confidence intervals for the regression coefficients. Regression was performed using both the firing rate and the eye movements from individual trials.
Fig. 8.
Fig. 8.
Analysis of simple-spike firing rate and eye velocity during the initiation of pursuit along an axis that mimicked the eye movements used to assess the on-direction learned component of pursuit. A: eye velocity as a function of time. B: firing rate as a function of time. Black and red traces show averages for initiation of pursuit in the mimic direction and in prelearning probe trials for a representative PC. Mimic trials provided target motion orthogonal to the preferred axis of the PC under study, plus a smaller component of target motion in the on- or off-direction. Prelearning probe trials comprised only the orthogonal component of target motion. C: regression analysis using Eq. 4 for the difference between the averages for the mimic direction and the prelearning probe trials. Black, red, purple, blue, and green traces show, respectively, the actual average firing rate, the prediction of the best-fitting regression model, and the eye acceleration, velocity, and position components of the regression model. D: cumulative probability distributions of VAF for the entire sample of PCs. Black, red, and blue traces show, respectively, data for the initiation of pursuit in the on-direction, the initiation of pursuit in the mimic direction for on-direction learning, and for the on-direction learned component of SS firing. E: comparison of peak eye velocity along the preferred axis for the learned component of pursuit vs. the mimic trials. Filled and open symbols show data for on-direction and off-direction pursuit. Oblique dashed line has a slope of 1. F: comparison of the dynamics of the preferred-axis components of the learned eye movement and the response to mimic target motion. Red and blue traces show the response to mimic trials and the learned component; solid and dashed curves show responses for on-direction and off-direction target motion. Traces are aligned so that the eye velocity responses have approximately the same onset time.
Fig. 9.
Fig. 9.
Statistical analysis of the difference between the eye velocity and acceleration sensitivities for the learned component of SS firing vs. the response during the initiation of pursuit along the mimic axis. A: eye velocity sensitivity in the on-direction. B: eye velocity sensitivity in the off-direction. C: eye acceleration sensitivity in the on-direction. D: eye acceleration sensitivity in the off-direction. Filled and open symbols summarize the regression analysis for the responses to step-ramp target motion along the mimic axis, and for the learned component of SS firing. Error bars indicate confidence intervals for the regression coefficients. Solid traces show the results of the same analysis for the responses to step-ramp target motion along the mimicry axis, compared with that along the preferred axis. Regression was performed using the firing rate from individual trials and the averages of eye movement across trials.
Fig. 10.
Fig. 10.
Similarity of regression coefficients for initiation of pursuit at different target speeds. A: cumulative distribution of VAF for target motion at 10, 20, and 30°/s. BD: scatterplots showing similarity of velocity sensitivity (B), positive acceleration sensitivity (C), and position sensitivity (D) of PC firing rate during target motion at 10 or 30 vs. 20°/s. Each symbol shows data for an individual PC.
Fig. 11.
Fig. 11.
Comparison of regression coefficients for eye velocity for the learned component of pursuit vs. the initiation of pursuit in the on-direction of each PC. Each symbol in the scatter responses shows data from an individual PC. Each point shows data from a single PC and different graphs summarize the results obtained with different regression models. A: Equation 2 for initiation, Eq. 1 for learning. B: Equation 1 for both initiation and learning. C: Equation 4 for initiation, Eq. 1 for learning. D: Equation 4 for initiation, Eq. 3 for learning. E: Equation 3 for both initiation and learning. F: Equation 4 for initiation, Eq. 2 for learning. The large open symbol in each graph shows the averages across the full sample of PCs.
Fig. 12.
Fig. 12.
Comparison of regression coefficients for eye velocity for the learned component of pursuit vs. the initiation of pursuit in the off-direction of each PC. Each symbol in the scatter responses shows data from an individual PC. Each point shows data from a single PC and different graphs summarize the results obtained with different regression models. A: Equation 2 for initiation, Eq. 1 for learning. B: Equation 1 for both initiation and learning. C: Equation 4 for initiation, Eq. 1 for learning. D: Equation 4 for initiation, Eq. 3 for learning. E: Equation 3 for both initiation and learning. F: Equation 4 for initiation, Eq. 2 for learning. The large open symbol in each graph shows the averages across the full sample of PCs.
Fig. 13.
Fig. 13.
Relationship between learned change in sensitivity to eye velocity and other parameters of PC responses. In all graphs, the y-axis plots the sensitivity to eye velocity of the learned component of firing rate, measured during probe trials, minus the sensitivity to eye velocity during the normal initiation of pursuit. A and B: data for all PCs in our sample, plotting the learning-related difference in eye velocity sensitivity vs. the sensitivity to eye acceleration (A) or eye velocity (B) during the normal initiation of pursuit along the preferred axis of the PC under study. C: data for a small sample of PCs for which the complex spike response remained isolated during a full set of learning trials. The graph plots the learning-related difference in eye velocity sensitivity vs. the size of the complex response, measured during the first 50 learning trials and expressed as a multiple of the baseline complex spike firing. In all 3 panels, filled and open symbols show data for on- vs. off-direction pursuit.
Fig. 14.
Fig. 14.
Inverse model analysis based on the average responses across the population of floccular PCs. Each panel shows actual and predicted firing rate as a function of time. In all 4 panels, black traces show actual firing rate and red traces show the prediction of the linear regression model for the actual firing rate. Responses for on-direction and off-direction pursuit shown as positive and negative going traces, respectively. In B and D, blue traces show the predicted learned component of firing rate based on the regression coefficients obtained for normal pursuit of step-ramp target motion. A and B show data for pursuit along the preferred axes of the PCs under study, whereas C and D show analysis for pursuit along the axis that mimicked the speed and direction of the learned component of pursuit.

Similar articles

Cited by

References

    1. Albus JS. A theory of cerebellar function. Math Biosci 10: 25–61, 1971
    1. Blazquez PM, Hirata Y, Heiney SA, Green AM, Highstein SM. Cerebellar signatures of vestibulo-ocular reflex motor learning. J Neurosci 23: 9742–9751, 2003 - PMC - PubMed
    1. Buonomano DV, Mauk MD. Neural network model of the cerebellumml: temporal discrimination and the timing of motor responses. Neural Comput 6: 38–55, 1994
    1. Catz N, Dicke PW, Their P. Cerebellar-dependent motor learning is based on pruning a Purkinje cell population response. Proc Natl Acad Sci USA 105: 7309–7314, 2008 - PMC - PubMed
    1. Chou I, Lisberger SG. Role of the frontal pursuit area in motor learning in smooth pursuit eye movements in monkeys. J Neurosci 24: 4124–4133, 2004 - PMC - PubMed

Publication types

LinkOut - more resources