

Acute molecular response of mouse hindlimb muscles to chronic stimulation
- PMID: 19625612
- PMCID: PMC2740398
- DOI: 10.1152/ajpcell.00046.2009
Acute molecular response of mouse hindlimb muscles to chronic stimulation
Abstract
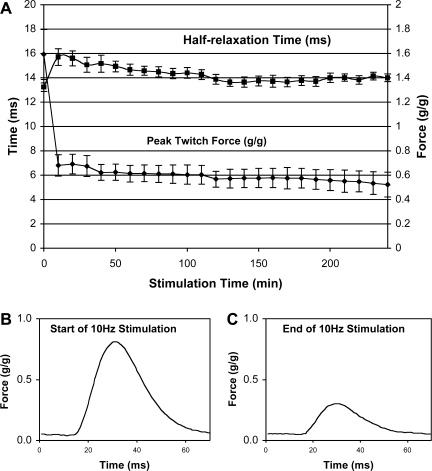
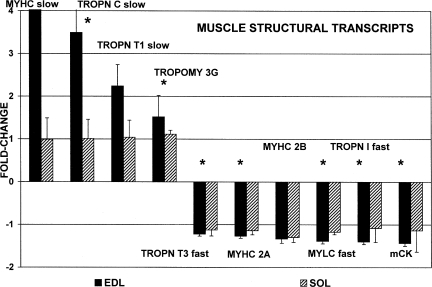
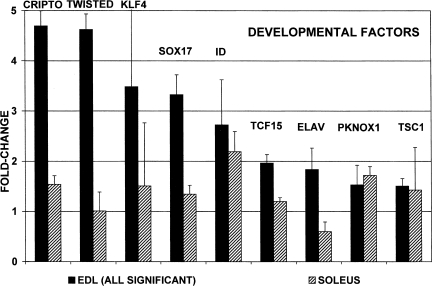
Stimulation of the mouse hindlimb via the sciatic nerve was performed for a 4-h period to investigate acute muscle gene activation in a model of muscle phenotype conversion. Initial force production (1.6 +/- 0.1 g/g body wt) declined 45% within 10 min and was maintained for the remainder of the experiment. Force returned to initial levels upon study completion. An immediate-early growth response was present in the extensor digitorum longus (EDL) muscle (FOS, JUN, activating transcription factor 3, and musculoaponeurotic fibrosarcoma oncogene) with a similar but attenuated pattern in the soleus muscle. Transcript profiles showed decreased fast fiber-specific mRNA (myosin heavy chains 2A and 2B, fast troponins T(3) and I, alpha-tropomyosin, muscle creatine kinase, and parvalbumin) and increased slow transcripts (myosin heavy chain-1beta/slow, troponin C slow, and tropomyosin 3y) in the EDL versus soleus muscles. Histological analysis of the EDL revealed glycogen depletion without inflammatory cell infiltration in stimulated versus control muscles, whereas ultrastructural analysis showed no evidence of myofiber damage after stimulation. Multiple fiber type-specific transcription factors (tea domain family member 1, nuclear factor of activated T cells 1, peroxisome proliferator-activated receptor-gamma coactivator-1alpha and -beta, circadian locomotor output cycles kaput, and hypoxia-inducible factor-1alpha) increased in the EDL along with transcription factors characteristic of embryogenesis (Kruppel-like factor 4; SRY box containing 17; transcription factor 15; PBX/knotted 1 homeobox 1; and embryonic lethal, abnormal vision). No established in vivo satellite cell markers or genes activated in our parallel experiments of satellite cell proliferation in vitro (cyclins A(2), B(2), C, and E(1) and MyoD) were differentially increased in the stimulated muscles. These results indicated that the molecular onset of fast to slow phenotype conversion occurred in the EDL within 4 h of stimulation without injury or satellite cell recruitment. This conversion was associated with the expression of phenotype-specific transcription factors from resident fiber myonuclei, including the activation of nascent developmental transcriptional programs.
Figures


Similar articles
-
"Fast" and "slow" muscle fibres in hindlimb muscles of adult rats regenerate from intrinsically different satellite cells.J Physiol. 2005 Feb 1;562(Pt 3):847-57. doi: 10.1113/jphysiol.2004.073684. Epub 2004 Nov 25. J Physiol. 2005. PMID: 15564285 Free PMC article.
-
Early changes in muscle fiber size and gene expression in response to spinal cord transection and exercise.Am J Physiol. 1998 Oct;275(4):C1124-33. doi: 10.1152/ajpcell.1998.275.4.C1124. Am J Physiol. 1998. PMID: 9755066
-
Contractile activity-induced gene expression in fast- and slow-twitch muscle.Appl Physiol Nutr Metab. 2011 Apr;36(2):233-41. doi: 10.1139/h11-004. Appl Physiol Nutr Metab. 2011. PMID: 21609285
-
Muscle mechanics: adaptations with exercise-training.Exerc Sport Sci Rev. 1996;24:427-73. Exerc Sport Sci Rev. 1996. PMID: 8744258 Review.
-
Excitation-transcription coupling in skeletal muscle: the molecular pathways of exercise.Biol Rev Camb Philos Soc. 2011 Aug;86(3):564-600. doi: 10.1111/j.1469-185X.2010.00161.x. Epub 2010 Oct 6. Biol Rev Camb Philos Soc. 2011. PMID: 21040371 Free PMC article. Review.
Cited by
-
Selective inhibition of ATPase activity during contraction alters the activation of p38 MAP kinase isoforms in skeletal muscle.J Cell Biochem. 2013 Jun;114(6):1445-55. doi: 10.1002/jcb.24486. J Cell Biochem. 2013. PMID: 23296747 Free PMC article.
-
Altered mRNA expression after long-term soleus electrical stimulation training in humans with paralysis.Muscle Nerve. 2011 Jan;43(1):65-75. doi: 10.1002/mus.21831. Muscle Nerve. 2011. PMID: 21171097 Free PMC article.
-
Antenatal maternal long-term hypoxia: acclimatization responses with altered gene expression in ovine fetal carotid arteries.PLoS One. 2013 Dec 18;8(12):e82200. doi: 10.1371/journal.pone.0082200. eCollection 2013. PLoS One. 2013. PMID: 24367503 Free PMC article.
-
Effects of Pulsed Electromagnetic Field Treatment on Skeletal Muscle Tissue Recovery in a Rat Model of Collagenase-Induced Tendinopathy: Results from a Proteome Analysis.Int J Mol Sci. 2024 Aug 14;25(16):8852. doi: 10.3390/ijms25168852. Int J Mol Sci. 2024. PMID: 39201538 Free PMC article.
-
Temporal adaptive changes in contractility and fatigability of diaphragm muscles from streptozotocin-diabetic rats.J Biomed Biotechnol. 2010;2010:931903. doi: 10.1155/2010/931903. Epub 2010 May 6. J Biomed Biotechnol. 2010. PMID: 20467472 Free PMC article.
References
-
- Adams GR. Satellite cell proliferation and skeletal muscle hypertrophy. Appl Physiol Nutr Metab 31: 782–790, 2006 - PubMed
-
- Baldwin KM, Haddad F. Skeletal muscle plasticity: cellular and molecular responses to altered physical activity paradigms. Am J Phys Med Rehabil 81: S40–S51, 2002 - PubMed
-
- Bassel-Duby R, Olson EN. Signaling pathways in skeletal muscle remodeling. Annu Rev Biochem 75: 19–37, 2006 - PubMed
Publication types
MeSH terms
Substances
Grants and funding
LinkOut - more resources
Full Text Sources
Molecular Biology Databases
Research Materials
Miscellaneous