. 2009 Aug 4;106(31):12855-60.
doi: 10.1073/pnas.0901282106. Epub 2009 Jul 22.

Characterization and distribution of retrotransposons and simple sequence repeats in the bovine genome

Affiliations

Characterization and distribution of retrotransposons and simple sequence repeats in the bovine genome

David L Adelson et al. Proc Natl Acad Sci U S A. .

Abstract

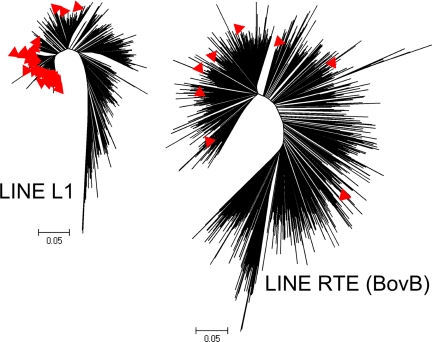
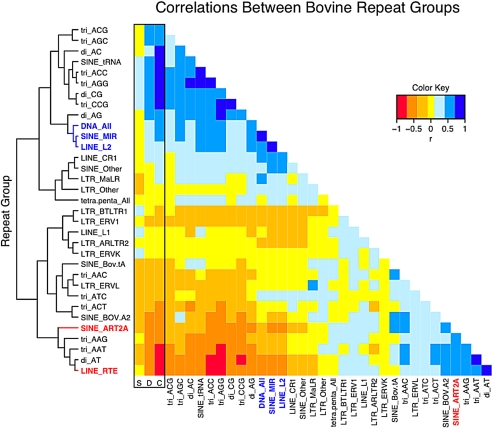
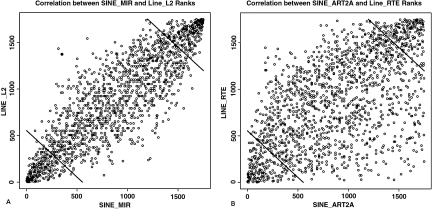
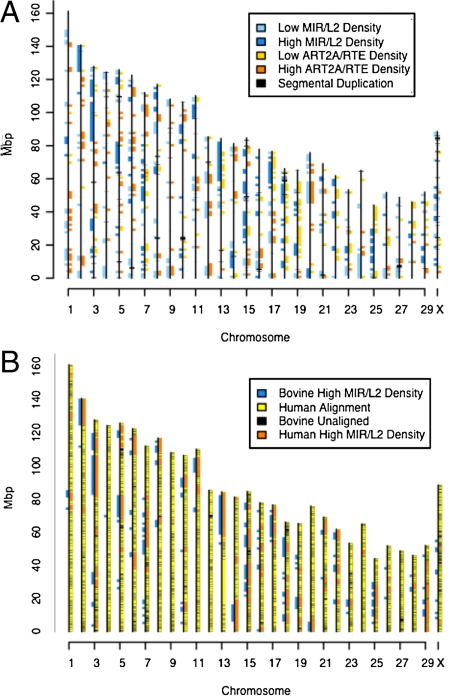
Interspersed repeat composition and distribution in mammals have been best characterized in the human and mouse genomes. The bovine genome contains typical eutherian mammal repeats, but also has a significant number of long interspersed nuclear element RTE (BovB) elements proposed to have been horizontally transferred from squamata. Our analysis of the BovB repeats has indicated that only a few of them are currently likely to retrotranspose in cattle. However, bovine L1 repeats (L1 BT) have many likely active copies. Comparison of substitution rates for BovB and L1 BT indicates that L1 BT is a younger repeat family than BovB. In contrast to mouse and human, L1 occurrence is not negatively correlated with G+C content. However, BovB, Bov A2, ART2A, and Bov-tA are negatively correlated with G+C, although Bov-tAs correlation is weaker. Also, by performing genome wide correlation analysis of interspersed and simple sequence repeats, we have identified genome territories by repeat content that appear to define ancestral vs. ruminant-specific genomic regions. These ancestral regions, enriched with L2 and MIR repeats, are largely conserved between bovine and human.


Conflict of interest statement

The authors declare no conflict of interest.

Figures

Fig. 1.
Fig. 1.
Intact LINE trees. Maximum Likelihood trees derived from global alignments of all intact/full-length LINE sequences. Red triangles indicate potentially active LINEs based on their intact ORF content.
Fig. 2.
Fig. 2.
Correlation analysis of repeat groups. Pairwise correlations among the repeat groups and between the repeat groups and segmental duplication (column S), gene density (column D), and G+C content (column C). Repeat groups are clustered based on all their correlations. Yellow cells have nonsignificant correlations (95% 2-tailed test after Bonferroni correction). Blue cells indicate significant positive correlations, and the orange/red cells indicate significant negative correlations.
Fig. 3.
Fig. 3.
Rank correlations for ancestral and recent LINE/SINE pairs. (Left) Ranks of the ancestral LINE L2 and SINE MIR counts for each 1.5-Mbp bin. (Right) Ranks of recent LINE RTE (BovB) and SINE ART2A counts for each 1.5-Mbp bin. Lines in the upper right and lower left corners indicate the cut off for the high and low density bins, respectively, and are based on the expected 5% tails from the random distribution of the sum of the ranks.
Fig. 4.
Fig. 4.
Ancestral and new repeat groups define different genomic territories. (A) Locations of 1.5-Mbp bins with extreme (high and low) ancestral (L2/MIR) and recent RTE/ART2A repeat densities are shown on the Btau4 assembly. Locations of the segmental duplications are plotted in black. Ancestral repeats tend to occur in blocks, whereas recent repeats generally do not. There is no overlap between high-density ancestral repeat blocks and bins with a high density of recent repeat blocks. Segmental duplications do not appear to colocalize with either high- or low-density regions of either repeat class. (B) Ancestral (L2/MIR) high-density bins for bovine and human are shown on the bovine assembly, along with the overall alignment from Cow-Net (–25). Note that the “top” of the chromosomes corresponds to the end near the x axis on our plot. The y axis corresponds to nucleotide coordinates in mega base pairs (Mbp) from the bovine assembly Btau4.

References

    1. Smit AF. The origin of interspersed repeats in the human genome. Curr Opin Genet Dev. 1996;6:743–748. - PubMed
    1. Lander ES, et al. Initial sequencing and analysis of the human genome. Nature. 2001;409:860–921. - PubMed
    1. Jurka J, Kapitonov VV, Kohany O, Jurka MV. Repetitive sequences in complex genomes: Structure and evolution. Annu Rev Genom Hum G. 2007;8:241–259. - PubMed
    1. Waterston RH, et al. Initial sequencing and comparative analysis of the mouse genome. Nature. 2002;420:520–562. - PubMed
    1. Smit AFA, Riggs AD. MIRs are classic, transfer-RNA-derived SINEs that amplified before the mammalian radiation. Nucleic Acids Res. 1995;23:98–102. - PMC - PubMed

LinkOut - more resources