. 2009 Aug 4;106(31):12956-61.
doi: 10.1073/pnas.0906005106. Epub 2009 Jul 22.

Role of human noncoding RNAs in the control of tumorigenesis

Affiliations

Role of human noncoding RNAs in the control of tumorigenesis

Ling Li et al. Proc Natl Acad Sci U S A. .

Abstract

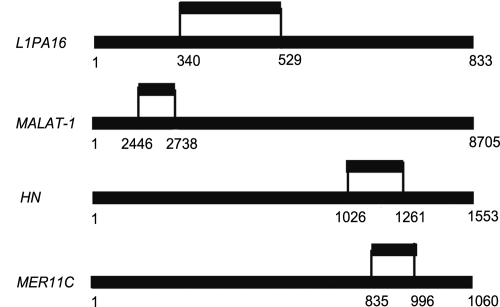
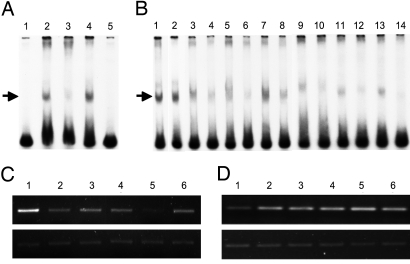
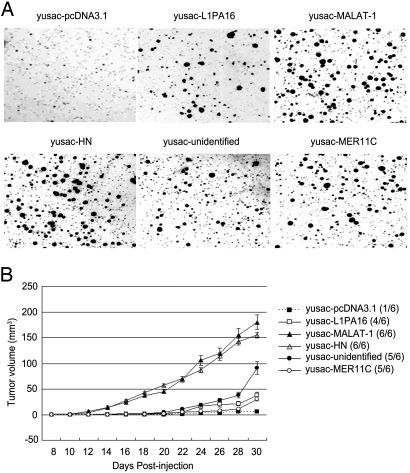
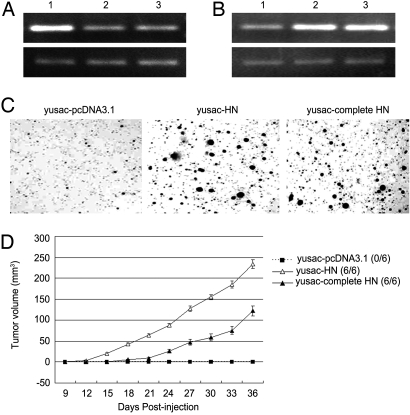
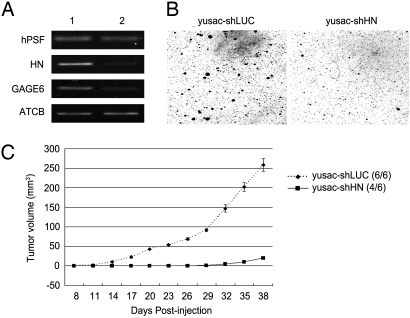
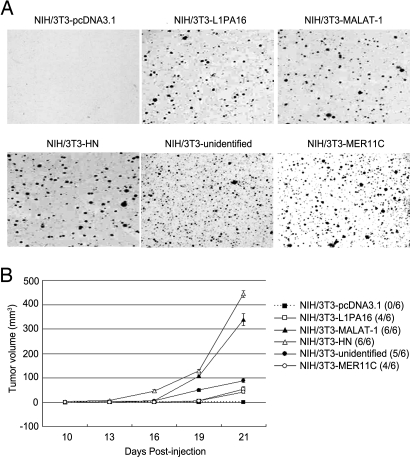
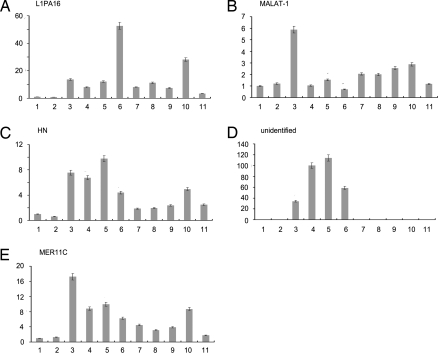
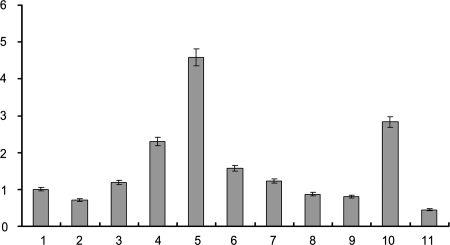
Related studies showed that the protein PSF represses proto-oncogene transcription, and VL30-1 RNA, a mouse noncoding retroelement RNA, binds and releases PSF from a proto-oncogene, activating transcription. Here we show that this mechanism regulates tumorigenesis in human cells, with human RNAs replacing VL30-1 RNA. A library of human RNA fragments was used to isolate, by affinity chromatography, 5 noncoding RNA fragments that bind to human PSF (hPSF), releasing hPSF from a proto-oncogene and activating transcription. Each of the 5 RNA fragments maps to a different human gene. The tumorigenic function of the hPSF-binding RNAs was tested in a human melanoma line and mouse fibroblast line, by determining the effect of the RNAs on formation of colonies in agar and tumors in mice. (i) Expressing in human melanoma cells the RNA fragments individually promoted tumorigenicity. (ii) Expressing in human melanoma cells a shRNA, which causes degradation of the endogenous RNA from which an RNA fragment was derived, suppressed tumorigenicity. (iii) Expressing in mouse NIH/3T3 cells the RNA fragments individually resulted in transformation to tumorigenic cells. (iv) A screen of 9 human tumor lines showed that each line expresses high levels of several hPSF-binding RNAs, relative to the levels in human fibroblast cells. We conclude that human hPSF-binding RNAs drive transformation and tumorigenesis by reversing PSF-mediated repression of proto-oncogene transcription and that dysfunctional regulation of human hPSF-binding RNA expression has a central role in the etiology of human cancer.


Conflict of interest statement

The authors declare no conflict of interest.

Figures

Fig. 1.
Fig. 1.
Locations of human hPSF-binding RNA fragments in the human genome, based on sequence identity within a gene. The upper line shows the RNA fragment, and the lower line shows the gene. The L1PA16 gene is on chromosome 3 at 177842604–177843436; the MALAT-1 gene is on chromosome 11 at 65021809–65030513; the HN gene is on chromosome M (mitochondrial) at 1685–3237; and the MER11C gene is on chromosome 11 at 50410308–50411367. A fifth fragment maps to chromosome 6 at 165453538–165453778 within an unidentified gene. Further details are in SI Text.
Fig. 2.
Fig. 2.
Release of hPSF from the GAGE6 regulatory DNA by hPSF-binding RNAs. (A) Binding of hPSF to GAGE6 regulatory DNA. 32P-labeled GAGE6 regulatory DNA was mixed with a nuclear extract of YU-SIT1 melanoma cells, and 20 min later an anti-PSF monoclonal, or an anti-ATCB monoclonal antibody that does not bind hPSF, was added. The samples were incubated for 20 min at room temperature and fractionated by PAGE, and the gel was autoradiographed. Lane 1: GAGE6 regulatory DNA; Lane 2: GAGE6 regulatory DNA + nuclear extract; Lane 3: GAGE6 regulatory DNA + nuclear extract + anti-PSF antibody; Lane 4: GAGE6 regulatory DNA + nuclear extract + anti-ATCB antibody; Lane 5: GAGE6 regulatory DNA + E. coli protein. The high mobility bands at the bottom of the gel indicate free GAGE6 regulatory DNA, and the low mobility bands marked by an arrow indicate the GAGE6 regulatory DNA/hPSF complex. (B) Release of hPSF from GAGE6 regulatory DNA in vitro by hPSF-binding RNAs. 32P-labeled GAGE6 regulatory DNA was incubated with a nuclear extract of YU-SIT1 cells, and 20 min later a hPSF-binding RNA or control RNA was added. Lane 1: GAGE6 regulatory DNA + nuclear extract without added RNA; Lanes 2–14: GAGE6 regulatory DNA + nuclear extract with added RNA; Lane 2: control RNA encoded by pcDNA-3.1; Lanes 3 and 4: mouse VL30–1 RNA; Lanes 5 and 6: L1PA16 RNA fragment; Lanes 7 and 8: MALAT-1 RNA fragment; Lanes 9 and 10: HN RNA fragment; Lanes 11 and 12: unidentified RNA fragment; Lanes 13 and 14: MER11C RNA fragment. The high mobility bands at the bottom of the gel indicate the free GAGE6 regulatory DNA, and the low mobility bands marked by an arrow indicate the GAGE6 regulatory DNA/hPSF complex. The molar ratio of RNA to GAGE6 regulatory DNA was 30 in Lanes 3, 5, 7, 9, 11, and 13, and 100 in Lanes 2, 4, 6, 8, 10, 12, and 14. (C) Release of hPSF from GAGE6 regulatory DNA in vivo by human hPSF-binding RNA fragments. The parental yusac line was stably transfected with plasmid pcDNA-3.1 and plasmid pcDNA-3.1 encoding 1 of the human hPSF-binding RNA fragments, and yusac-pcDNA3.1 and yusac-RNA lines were cloned. An anti-PSF antibody was used to immunoprecipitate hPSF from the cell lines, and the amount of GAGE6 regulatory DNA co-precipitated with hPSF was assayed by semiquantitative PCR. Upper shows the immunoprecipitated GAGE6 regulatory DNA, and Lower shows the amount of total GAGE6 regulatory DNA used to normalize the amount of total DNA in the samples. Lane 1: yusac-pcDNA3.1 control; Lane 2: yusac-L1PA16; Lane 3: yusac-MALAT-1; Lane 4: yusac-HN; Lane 5: yusac-unidentified RNA; Lane 6: yusac-MER11C. (D) Activation of GAGE6 transcription in vivo by human hPSF-binding RNA fragments. The amount of GAGE6 mRNA was determined by semiquantitative RT-PCR. Upper shows the amount of GAGE6 cDNA, and Lower shows the amount of ATCB cDNA used to normalize the total RNA in the samples. The cell lines for Lanes 1–6 are the same as for C.
Fig. 3.
Fig. 3.
Tumorigenic effect of increasing expression of human hPSF-binding RNA fragments in the human melanoma line yusac. The yusac cells were stably transfected with plasmid pcDNA-3.1 as a control or pcDNA-3.1 encoding the indicated human RNA fragment. (A) Colony formation in agar. The agar was seeded with 5 × 10³ cells and solidified in petri dishes, and the colonies were stained and photographed after 2 weeks. (B) Tumor formation in nude mice. For each cell line, 3 mice were injected on opposite sides of the neck, using 5 × 10⁵ cells on each side. The number of injection sites that formed tumors is shown to the right (n/6), and the average size of the tumors on each day is shown in the curves on the left. The error bars show the mean value ± SE (n = 6). The procedures for A and B are described in Materials and Methods.
Fig. 4.
Fig. 4.
Tumorigenic effect of increasing expression of the hPSF-binding HN RNA fragment or intact HN RNA in the human melanoma line. The yusac cells were stably transfected with plasmid pcDNA-3.1 as a control or pcDNA-3.1 encoding the hPSF-binding HN RNA fragment or the intact HN RNA. (A) Release of hPSF from GAGE6 regulatory DNA. hPSF was immunoprecipitated from the transfected yusac cells with an anti-PSF antibody, and the amount of GAGE6 regulatory DNA co-precipitated with hPSF was determined by semiquantitative PCR. Upper shows the immunoprecipitated GAGE6 regulatory DNA, and Lower shows the amount of total GAGE6 regulatory DNA used to normalize the total DNA in the samples. Lane 1: yusac-pcDNA3.1 control; Lane 2: yusac-HN cells; Lane 3: yusac-complete HN cells. (B) Activation of GAGE6 transcription. The amount of GAGE6 mRNA was determined by semiquantitative RT-PCR. Upper shows the amount of GAGE6 cDNA, and Lower shows the amount of ATCB cDNA used to normalize the total RNA in the samples. The cells in Lanes 1–3 are the same as in A. (C) Colony formation in agar. The agar was seeded with 5 × 10³ cells and solidified in petri dishes, and the colonies were stained and photographed after 2 weeks. (D) Tumor formation in nude mice. For each cell line, 3 mice were injected on opposite sides of the neck, using 5 × 10⁵ cells on each side. The number of injection sites that formed tumors is shown to the right (n/6), and the average size of the tumors on each day is shown in the curves on the left. The error bars show the mean value ± SE (n = 6). The procedures for C and D are described in Materials and Methods.
Fig. 5.
Fig. 5.
Tumor suppression of yusac melanoma cells by an RNAi that degrades a hPSF-binding RNA. The yusac cells were stably transfected with a plasmid encoding a luciferase shRNA as a control (yusac-shLUC) or a HN-specific shRNA that initiates degradation of HN RNA by an RNAi (yusac-shHN). (A) Transcription of hPSF, HN, GAGE6, and ATCB, which is a constitutive RNA standard. Lane 1, yusac-shLUC cells; Lane 2, yusac-shHN cells. (B) Colony formation in agar. The agar was seeded with 1 × 10⁴ cells and solidified in petri dishes, and the colonies were stained and photographed after 4 weeks. (C) Tumor formation in nude mice. For each cell line, 3 mice were injected on opposite sides of the neck, using 2 × 10⁶ cells on each side. The number of injection sites that formed tumors is shown to the right (n/6), and the average size of the tumors on each day is shown in the curves on the left. The error bars show the mean value ± SE (n = 6). The procedures for B and C are described in Materials and Methods.
Fig. 6.
Fig. 6.
Transformation of NIH/3T3 cells by expression of a human hPSF-binding RNA fragment. The NIH/3T3 cells were stably transfected with plasmid pcDNA-3.1 as a control or pcDNA-3.1 encoding the indicated human RNA fragment. (A) Colony formation in agar. The agar was seeded with 1 × 10⁴ cells and solidified in petri dishes, and the colonies were stained and photographed after 3 weeks. (B) Tumor formation in nude mice. For each cell line, 3 mice were injected on opposite sides of the neck, using 2.5 × 10⁵ cells on each side. The number of injection sites that formed tumors is shown to the right (n/6), and the average size of the tumors on each day is shown in the curves on the left. The error bars show the mean value ± SE (n = 6). The procedures for A and B are described in Materials and Methods.
Fig. 7.
Fig. 7.
Expression of human hPSF-binding RNAs in human cells. (A) L1PA16. (B) MALAT-1. (C) HN. (D) Unidentified. (E) MER11C. Bar 1: BJ: fibroblast. Bar 2: HPF: primary foreskin fibroblast. Bars 3–6: A2058, SKmel28, YU-SIT1, and yusac melanoma lines. Bars 7–9: SMMC-7402, SMMC-7721, and HepG2: hepatocellular carcinoma lines. Bar 10: MCF7: breast tumor line. Bar 11: A549 non-small cell lung tumor line. Bars 2–11 show the amounts of hPSF-binding RNAs relative to the amount in Bar 1. The procedure is described in Materials and Methods.
Fig. 8.
Fig. 8.
Expression of hPSF in human cells. The cells for each bar are the same as in Fig. 7. Bars 2–11 show the amounts of hPSF mRNA relative to the amount in Bar 1.

Similar articles

Cited by

References

    1. Patton JG, Porro EB, Galceran J, Tempst P, Nadal-Ginard B. Cloning and characterization of PSF, a novel pre-mRNA splicing factor. Genes Develop. 1993;7:393–406. - PubMed
    1. Song X, et al. Retroviral-mediated transmission of a mouse VL30 RNA to human melanoma cells promotes metastasis in an immunodeficient mouse model. Proc Natl Acad Sci USA. 2002;99:6269–6273. - PMC - PubMed
    1. Song X, Sui A, Garen A. Binding of mouse VL30 retrotransposon RNA to PSF protein induces genes repressed by PSF: Effects on steroidogenesis and oncogenesis. Proc Natl Acad Sci USA. 2004;101:621–626. - PMC - PubMed
    1. Song X, Sun Y, Garen A. Roles of PSF protein and VL30 RNA in reversible gene regulation. Proc Natl Acad Sci USA. 2005;102:12189–12193. - PMC - PubMed
    1. Garen A, Song X. Regulatory roles of tumor-suppressor proteins and noncoding RNAs in cancer and normal cell functions. Int J Cancer. 2008;122:1687–1689. - PubMed

Publication types

LinkOut - more resources