Comparative Study
. 2009 Aug 15;183(4):2718-28.
doi: 10.4049/jimmunol.0900849. Epub 2009 Jul 22.

Human neutrophils coordinate chemotaxis by differential activation of Rac1 and Rac2

Affiliations
Comparative Study

Human neutrophils coordinate chemotaxis by differential activation of Rac1 and Rac2

Hui Zhang et al. J Immunol. .

Abstract

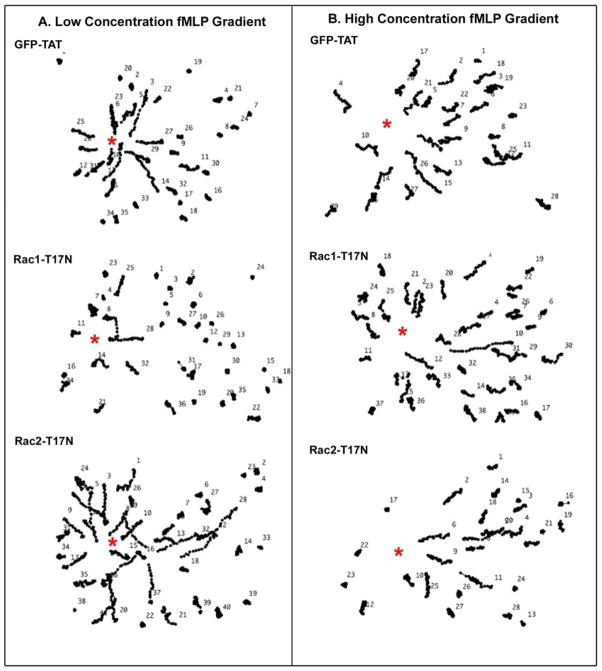
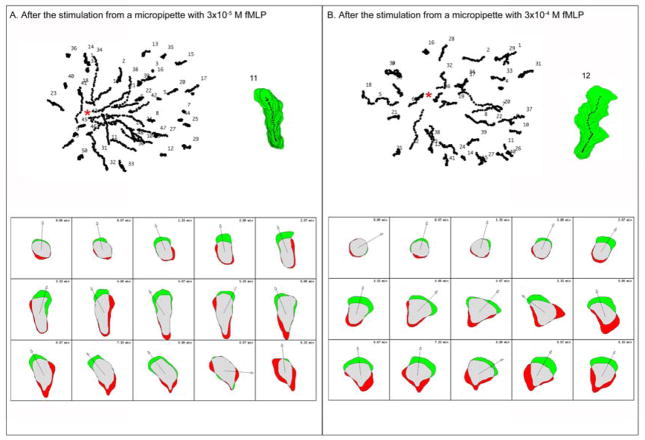
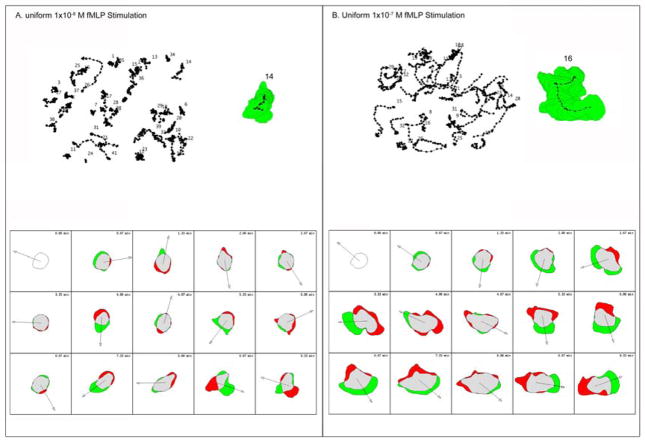
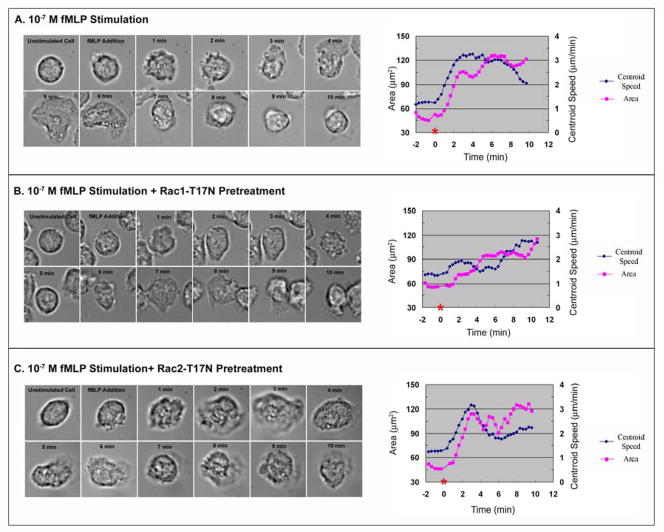
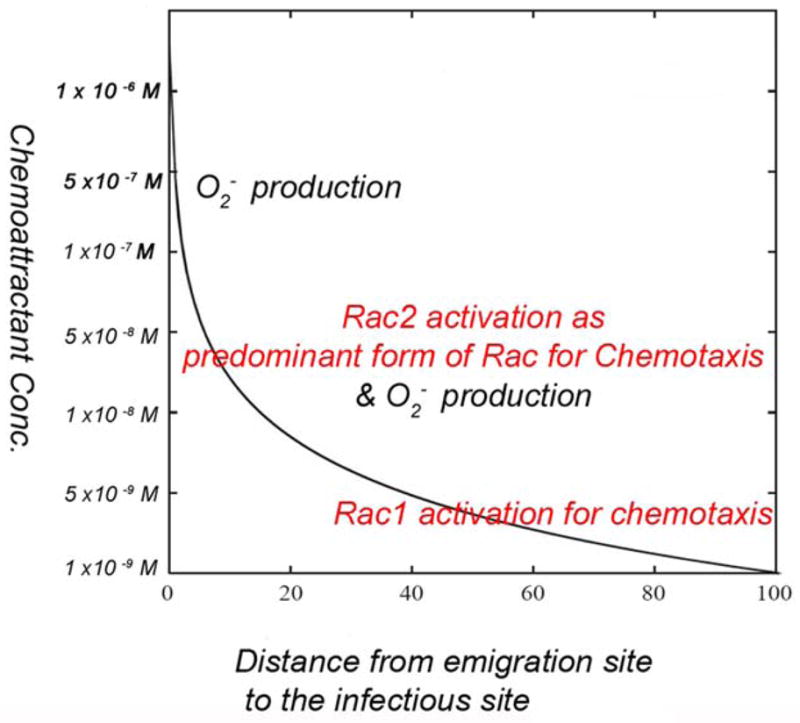
Rac1 and Rac2, members of the small Rho GTPase family, play essential roles in coordinating directional migration and superoxide production during neutrophil responses to chemoattractants. Although earlier studies in Rac1 and Rac2 knockout mice have demonstrated unique roles for each Rac isoform in chemotaxis and NADPH oxidase activation, it is still unclear how human neutrophils use Rac1 and Rac2 to achieve their immunological responses to foreign agent stimulation. In the current study, we used TAT dominant-negative Rac1-T17N and Rac2-T17N fusion proteins to acutely alter the activity of Rac1 and Rac2 individually in human neutrophils. We demonstrate distinct activation kinetics and different roles for Rac1 and Rac2 in response to low vs high concentrations of fMLP. These observations were verified using neutrophils from mice in which Rac1 or Rac2 was genetically absent. Based on these results, we propose a model to explain how human neutrophils kill invading microbes while limiting oxidative damage to the adjacent surrounding healthy tissue through the differential activation of Rac1 and Rac2 in response to different concentrations of chemoattractant.


Figures

Figure 1
Figure 1. The inhibition of Rac1 or Rac2 by Tat fusion proteins, Rac1-T17N or Rac2-T17N, resulted in different chemotactic responses in human neutrophils in high and low concentrations of fMLP gradients
(A) In a low fMLP concentration gradient, both GFP and Rac2-T17N pretreated human neutrophils showed normal migration tracks toward the source of fMLP (labeled with red asterisk), suggesting that the inhibition of Rac1 didn’t block neutrophil chemotaxis. However, Rac1-T17N pretreated human neutrophils showed impaired migration tracks toward the source of fMLP (labeled with red asterisk), indicating that the inhibition of Rac1 was able to block neutrophil chemotaxis in a low concentration gradient of fMLP. (B)In a high fMLP concentration gradient, both GFP-Tat and Rac1-T17N pretreated human neutrophils show normal cell tracks toward the source of fMLP (red asterisk), suggesting the inhibition of Rac1 didn’t block neutrophil chemotaxis. However, Rac2-T17N pretreated human neutrophils exhibited shorter migration tracks toward the source of fMLP (red asterisk), indicating the inhibition of Rac2 was able to block neutrophil chemotaxis in a high fMLP concentration gradient. (Results are representive from 3 independent experiments)
Figure 2
Figure 2. Human neutrophils show different morphological changes in response to different fMLP concentration gradients
(A) Human neutrophils were stimulated in a low concentration fMLP gradient. All the cell tracks are shown at the top left of panel A and the gradient source was indicated by the red asterisk. The cell stack of sample cell 11 is shown at the top right of panel A. At the bottom of panel A, the morphological changes of sample cell 11 at various times are shown in the form of a schematic cell, in which the green regions represent the expansion area of the cell and the red regions represent the retraction area of the cell. (B) Human neutrophils were stimulated in a high concentration fMLP gradient. All the cell tracks are shown at the top left of panel B and the gradient source was indicated by the red asterisk. The cell stack of sample cell 12 is shown at the top right of panel B. At the bottom of panel B, the morphological changes of sample cell 12 are shown in the form of schematic cells, as described above.
Figure 3
Figure 3. Human neutrophils show different morphological changes in response to different concentrations of uniform fMLP
(A) Human neutrophils were stimulated with a low uniform concentration of fMLP. All the cell tracks are shown at the top left of panel A. The cell stack of sample cell 14 is shown at the top right of panel A. At the bottom of panel A, the morphological changes of sample cell 14 are shown in the form of a schematic cell, in which the green regions represent the expansion area of the cell and the red regions represent the retraction area of the cell. (B) Human neutrophils were stimulated in a high uniform concentration of fMLP. All the cell tracks are shown at the top left of panel B. The cell stack of sample cell 16 is shown at the top right of panel B. At the bottom of panel B, the morphological changes of sample cell 16 are shown schematically, as described above.
Figure 4
Figure 4. Differential Rac GTPase regulation of neutrophil responses to a high concentration of uniform fMLP
(A) Left- Sequential DIC images of an untreated human neutrophil are shown during stimulation with uniform 10−7 M fMLP. Right- the measurements of cell area and centroid speed averaged from 30 cells were plotted against the time, where the time of fMLP addition (zero) is labeled with a red asterisk on the X-axis. (B) Sequential DIC images of a Rac1-T17N pretreated human neutrophil are shown during stimulation with uniform 10−7 M fMLP (left side of panel B). At the right side of panel B, the measurements of cell area and centroid speed averaged from 30 cells were plotted against the time, where the time of fMLP addition (zero) is labeled with a red asterisk on the X-axis. (C) Sequential DIC images of a Rac2-T17N pretreated human neutrophil are shown during a uniform 10−7 M fMLP stimulation (left side of panel C). At the right side of panel C, the measurements of cell area and centroid speed averaged from 30 cells are plotted against the time, where the time of fMLP addition (zero) is labeled with a red asterisk on the X-axis. (Results are collected from three independent experiments)
Figure 5
Figure 5. Differential Rac GTPase regulation of neutrophil responses to a high concentration of uniform fMLP verified using mouse neutrophils genetically deficient in Rac1 or Rac2
(A) Sequential DIC images of a wild type mouse neutrophil are shown during fMLP stimulation at the left of panel A. At the right of panel A, the measurements of cell area and centroid speed averaged from 30 cells were plotted against time. (B) Sequential DIC images of Rac1−/− mouse neutrophils are shown during fMLP sitmulation at the left of panel B. At the right of panel B, the measurements of cell area and centroid speed averaged from 30 cells were plotted against time. (C) Sequential DIC images of Rac2−/− mouse neutrophils are shown during fMLP stimulation at the left of panel C. At the right of panel C, the measurements of cell area and centroid speed averaged from 30 cells were plotted against time. (Results are collected from three independent experiments)
Figure 6
Figure 6. Adherent human neutrophils stimulated by1×10−7 M fMLP show a differential subcellular distribution of Rac1 and Rac2 with time of stimulation
(A) Freshly prepared human neutrophils were allowed to adhere to fibronectin-coated surface for 1 hour, stimulated with the final concentration of 1×10⁻⁷ M fMLP, and immunostained for Rac1 (green) and F-actin (red) at 0 min, 0.5 min, 1 min, 3 min, 5 min, 7 min and 9 min with Rac1-specific antibody (Upstate, 23A8) and phalloidin. (B) Freshly prepared human neutrophils were allowed adhere to fibronectin-coated surface for 1 hour, stimulated with the final concentration of 1×10⁻⁷ M fMLP, and immunostained for Rac2 (green) and F-actin (red) at 0 min, 0.5 min, 1 min, 3 min, 5 min, 7 min and 9 min with Rac2-specific antibody (R786) and phalloidin. In both A and B, the morphological changes were monitored through the corresponding DIC-DAPI images (top panels). (The result is representive of two independent experiment)
Figure 7
Figure 7. Rac1 and Rac2 are differently activated by uniform fMLP stimulation in human neutrophils
(A) Freshly prepared human neutrophils were allowed to adhere to fibronectin coated surface for 1 hour, were stimulated with the final concentration of 1×10⁻⁷ M fMLP for the time period indicated, and active Rac1 was detected by affinity-based PBD pulldown assay as described in Materials and Methods.. (B) Adherent human neutrophils were stimulated by 1×10⁻⁷ M fMLP for the times indicated. Active Rac2 was detected by affinity-based PBD pulldown assay. (C) The ratio of active Rac at each time point as compared to time zero was described as [Active Rac (time X)/Total Rac (time X)]/[Active Rac (0 min)/Total Rac (0 min)]. Therefore, if the ratio of active Rac to the zero time is 1, it means no activation of Rac. If the ratio is more than 1, it means activation of Rac, and if the ratio is less than 1, it means inhibition of Rac activation. The activation of Rac1 was increased throughout the first 4 minutes of stimulation, then dropped sharply between 4–6 minutes, but increased again after 7 minutes. Conversely, the activation of Rac2 was increased throughout the first 7 minutes, then decreased sharply after this time. (The result is representive of two independent experiments)
Figure 8
Figure 8. Model proposed to explain the regulation of Rac1 and Rac2 in a chemoattractant gradient from blood vessels to infectious sites
In this model, the X axis represents the distance from the emigration sites, where neutrophils migrate out of the blood vessels, to the infectious sites, where neutrophils exhibit inflammatory responses, such as superoxide production. The Y axis represents the predicted and deduced concentration range of fMLP (in log scale) over the distance from the emigration sites, where the fMLP concentration is lowest (1×10⁻⁹ M) to the infectious sites, where the fMLP concentration is highest (1×10⁻⁶ M). At the emigration site where the concentration of fMLP is low, neutrophils will activate Rac1 as the predominant form of Rac for initiating chemotaxis and directional migration. As neutrophils move towards the infectious sites, they experience a higher concentration of fMLP and activate both Rac1 and Rac2 to support both chemotaxis and inflammatory activity, such as superoxide production. Once neutrophils eventually reach the infectious site, under the high concentration of fMLP, only Rac2 is activated and the cells stop moving, allowing the neutrophils to stay at the infectious site for performing their inflammatory functions.

Similar articles

Cited by

References

    1. Kobayashi SD, Voyich JM, Burlak C, DeLeo FR. Neutrophils in the innate immune response. Arch Immunol Ther Exp (Warsz) 2005;53:505–517. - PubMed
    1. Segal AW. How neutrophils kill microbes. Annu Rev Immunol. 2005;23:197–223. - PMC - PubMed
    1. Smith JA. Neutrophils, host defense, and inflammation: a double-edged sword. J Leukoc Biol. 1994;56:672–686. - PubMed
    1. Fenteany G, Glogauer M. Cytoskeletal remodeling in leukocyte function. Curr Opin Hematol. 2004;11:15–24. - PubMed
    1. Bokoch GM, Zhao T. Regulation of the phagocyte NADPH oxidase by Rac GTPase. Antioxid Redox Signal. 2006;8:1533–1548. - PubMed

Publication types

MeSH terms